Grafana perfSONAR Dashboard Cookbook
Grafana is a popular open source visualization platform for building dashboards. It supports multiple data sources, including the OpenSearch database that is installed by default with the perfSONAR Toolkit and Archive bundles. This guide will walkthrough how to:
Install Grafana (you can skip this if you have an existing installation)
Setup an OpenSearch data source that points at your perfSONAR installation
Import the Matrix visualization plug-in
Import a pre-built set of dashboards for viewing the data
Provide tips for building your own dashboards
The following is required to use this guide:
A perfSONAR 5.0 or later host with either the Toolkit or Archive package installed.
A host where you can run Grafana that can reach port 443 on your perfSONAR host. This can be a separate host or can run on the same host where you have perfSONAR installed.
Step 1: Install Grafana
This step will walkthrough how to get Grafana running in a Docker container. If you have an existing Grafana installation you can skip this step.
Note
A Grafana installation via Docker is not required. Docker is used in this guide as a quick way to get up and running for users without an existing Grafana installation. Other Grafana installation methods work equally as well and have well-documented installation steps for a number of operating systems that can be found at Grafana Installation Instructions.
Note
The Docker setup in this document will not persist your changes, so it is best used for non-production purposes. Consult the Grafana documentation for persisting Docker installs.
If you do not have an existing installation but would like to experiment with perfSONAR and Grafana, then follow the steps below:
Login to a host running Docker where you want to install Grafana. Installing Docker is outside the scope of this document, but instructions can be found here: Docker Install Instructions.
Start the Grafana container (Note: Linux systems may require you to run as sudo):
docker run -d -p 3000:3000 --name grafana grafana/grafana-oss
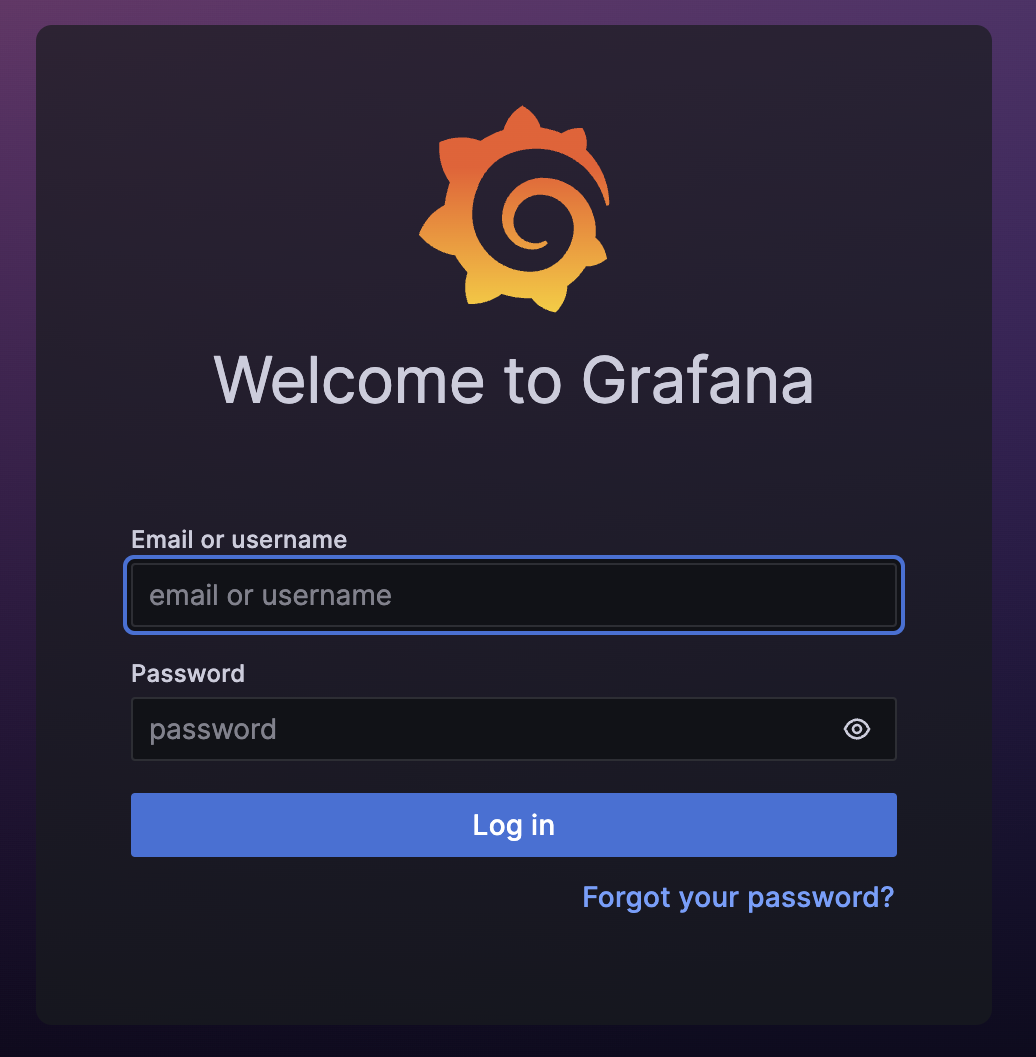
Verify that Grafana is running by opening your web browser to http://localhost:3000. Replace localhost with your Grafana host’s name if installed remotely. If it is running then you should see a page like the following:
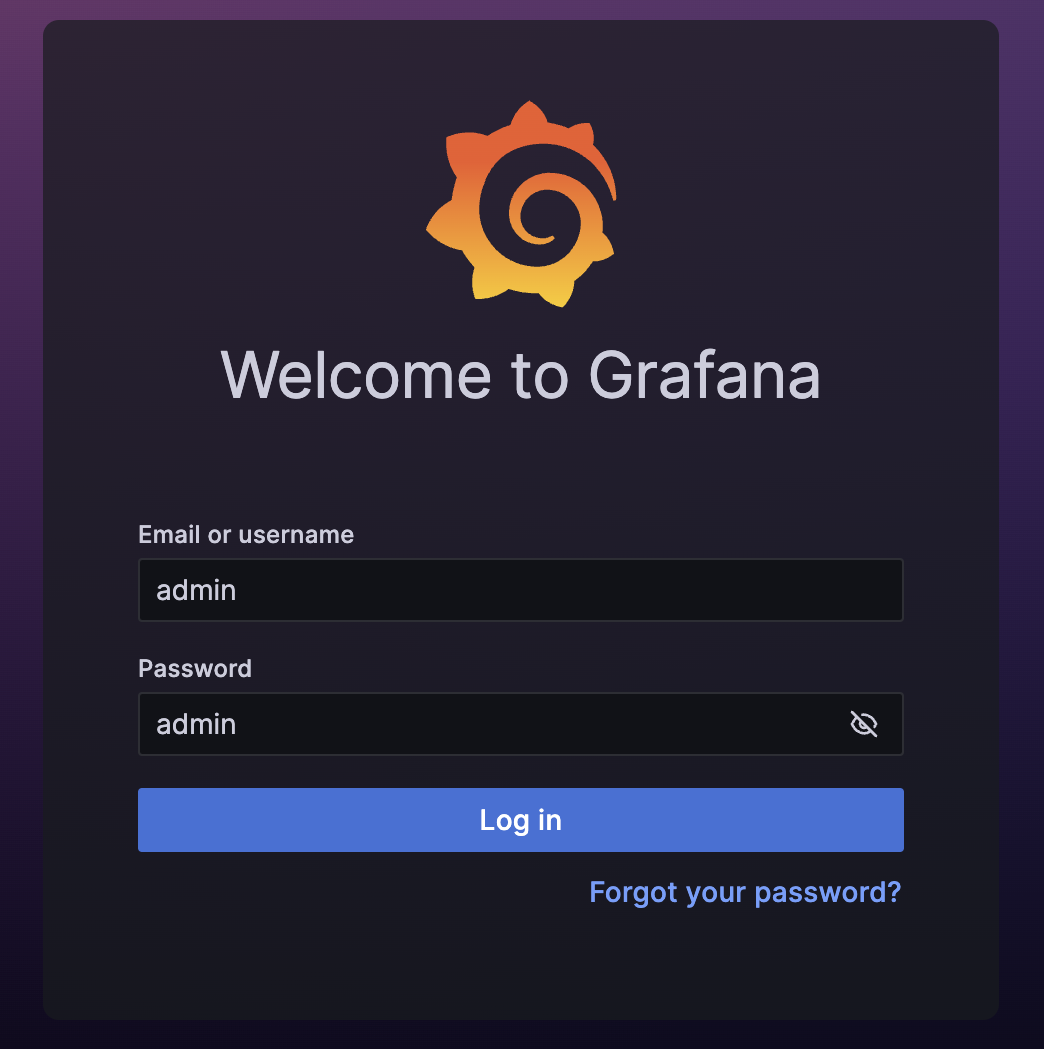
Login using the default username and password of admin/admin
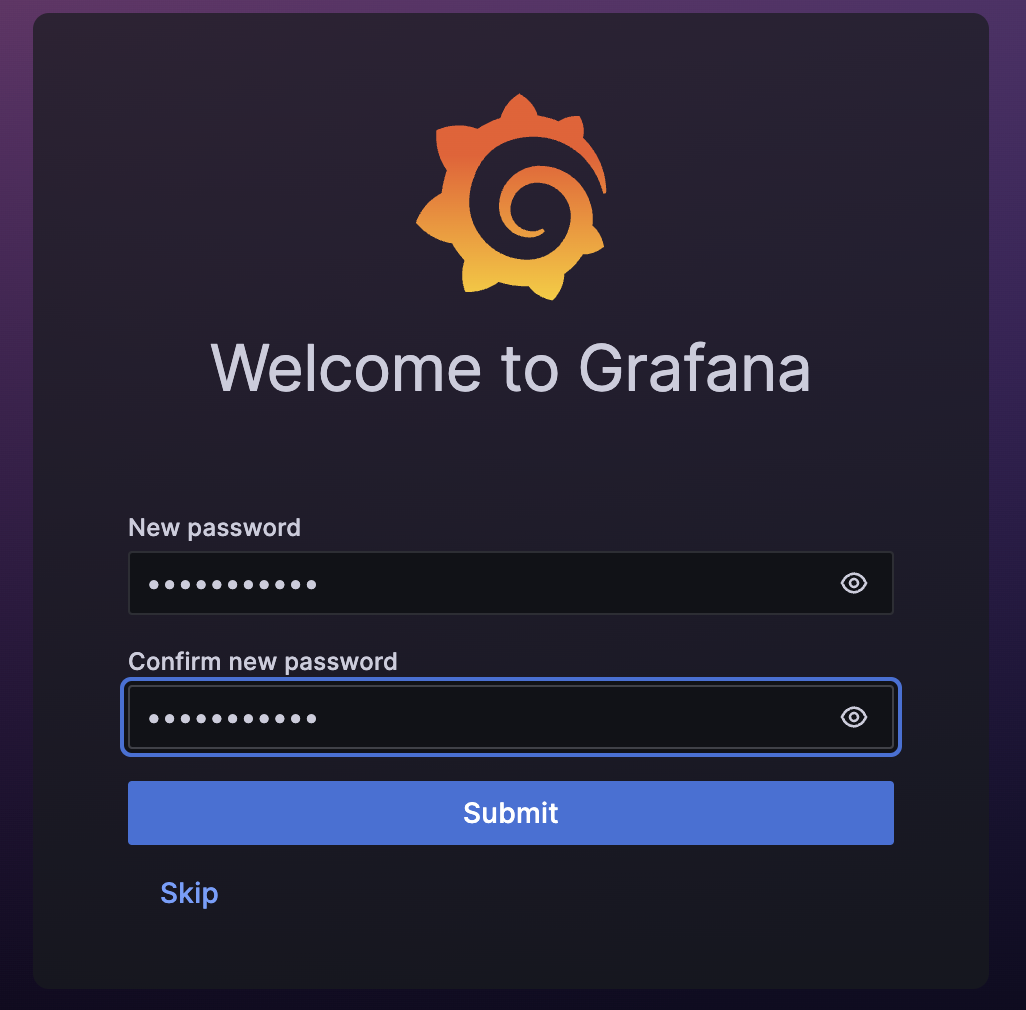
On the page that loads, change your password to something other than the default (or click Skip).
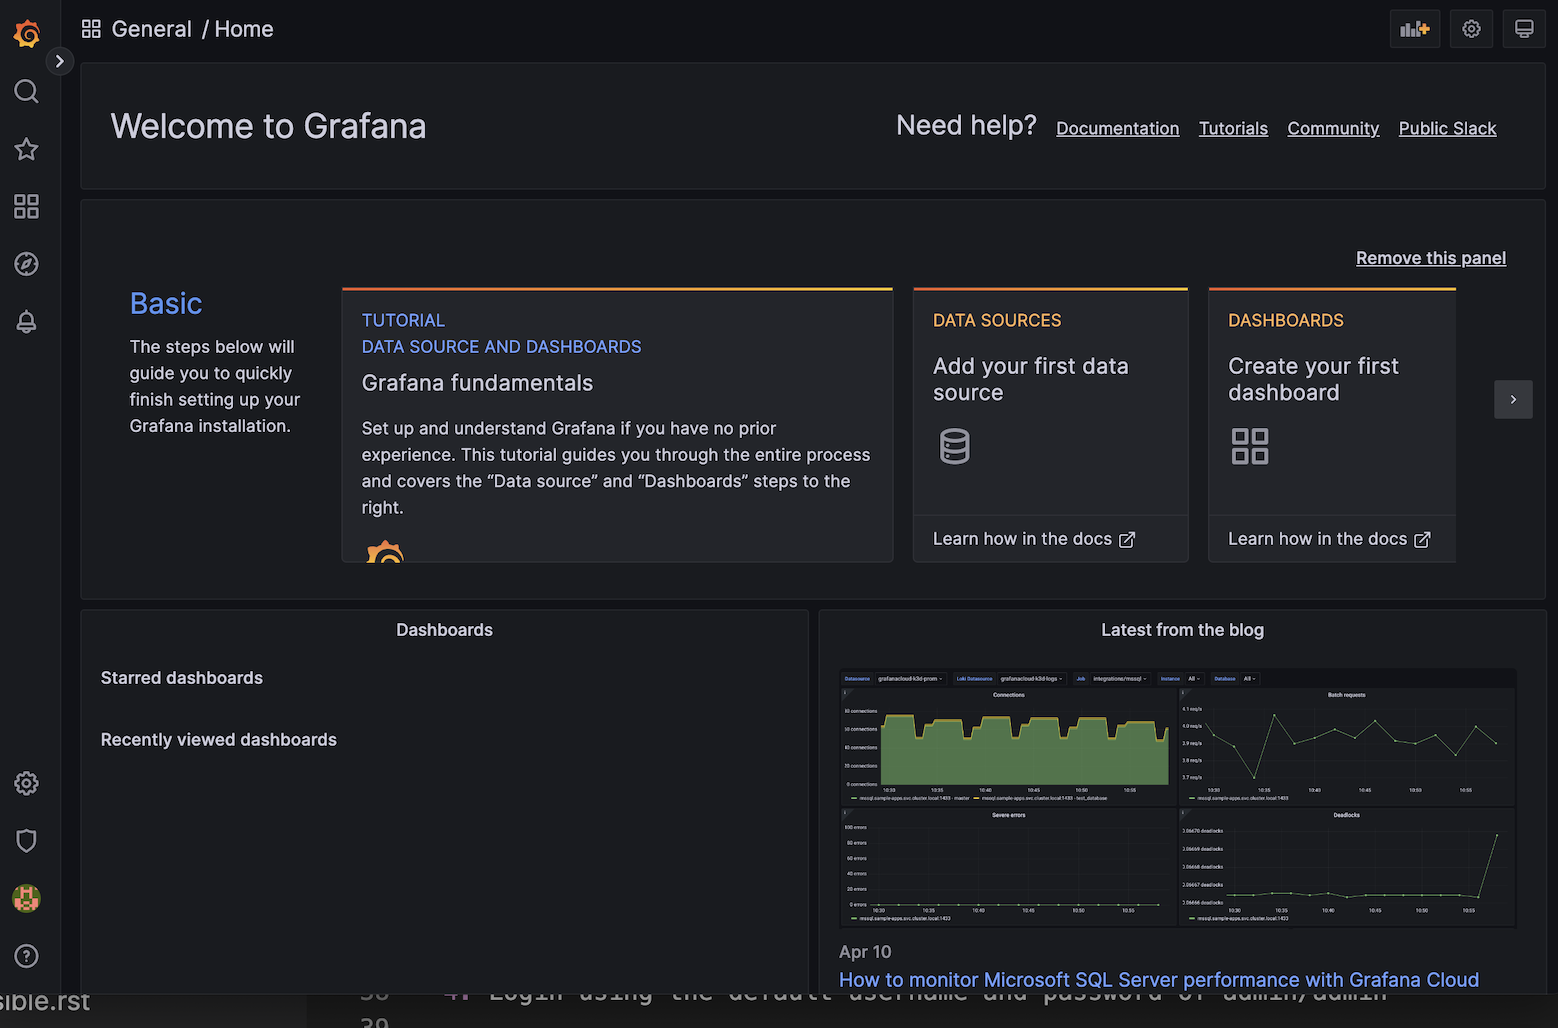
You should now be logged-in and see a page similar to the following:
Step 2: Install and Configure OpenSearch Data Source
In this step you will install and configure the OpenSearch data source plug-in used to talk to perfSONAR. The steps are as follows:
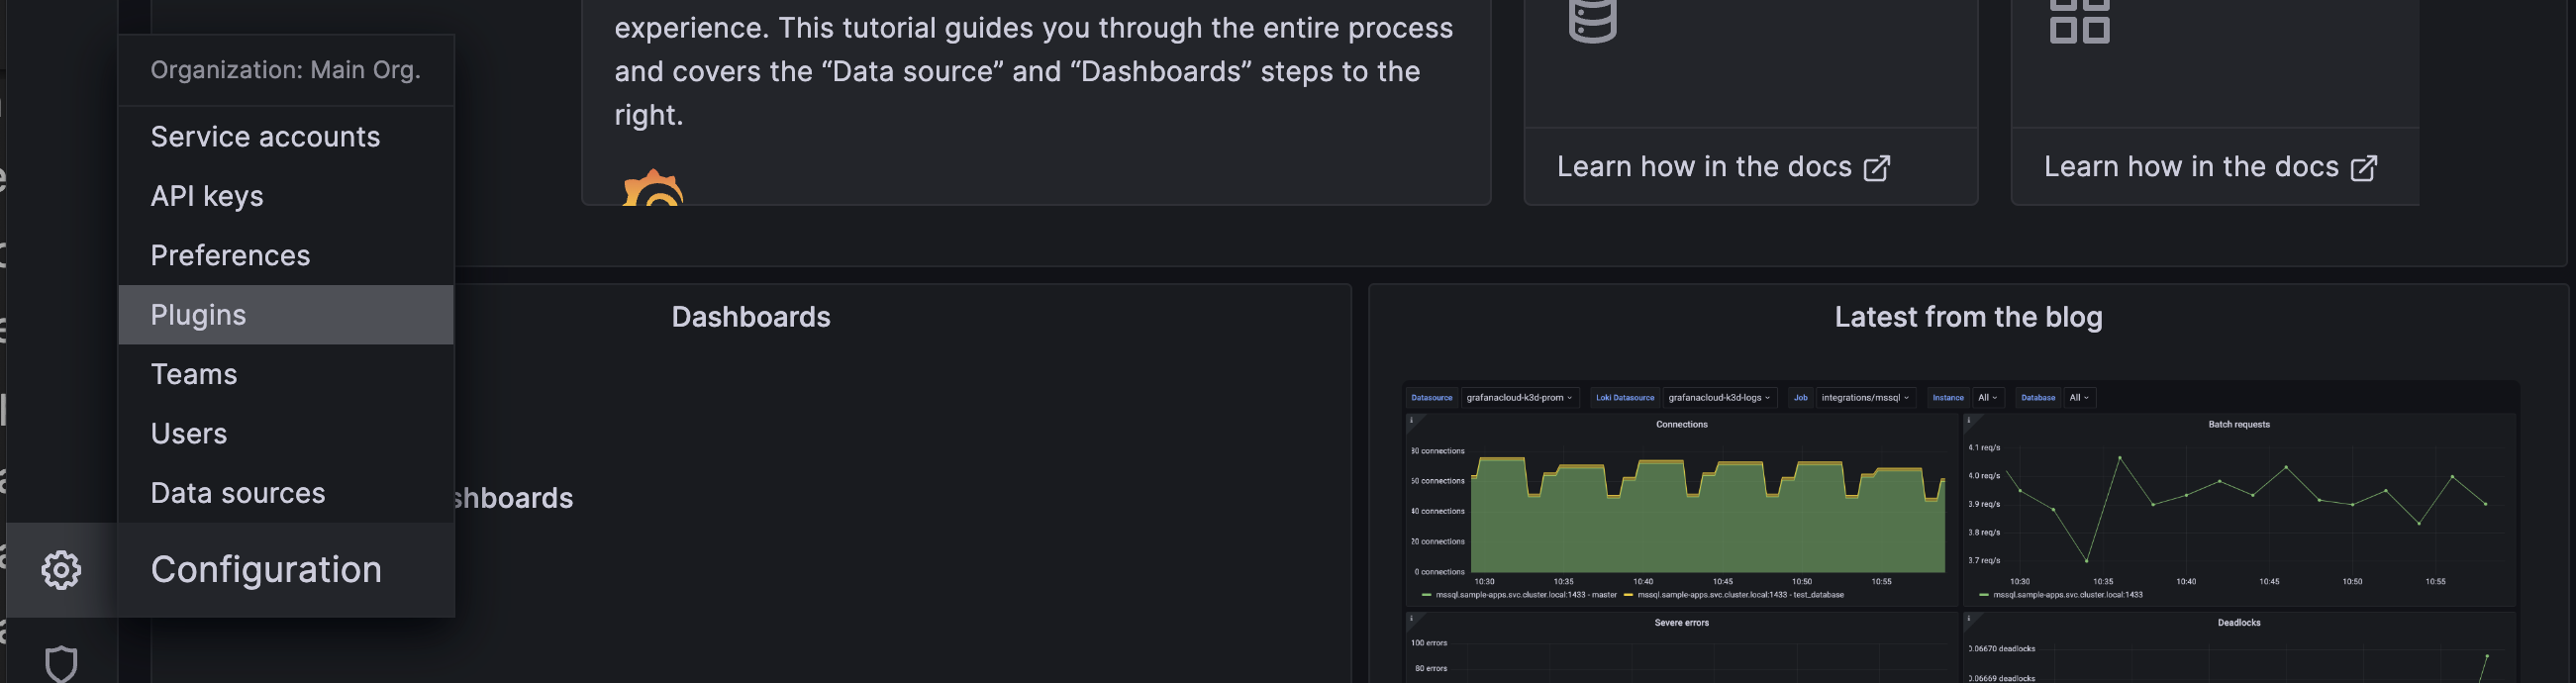
Hover over the Settings icon on the left (looks like a cog wheel) and select “Plugins” from the menu.
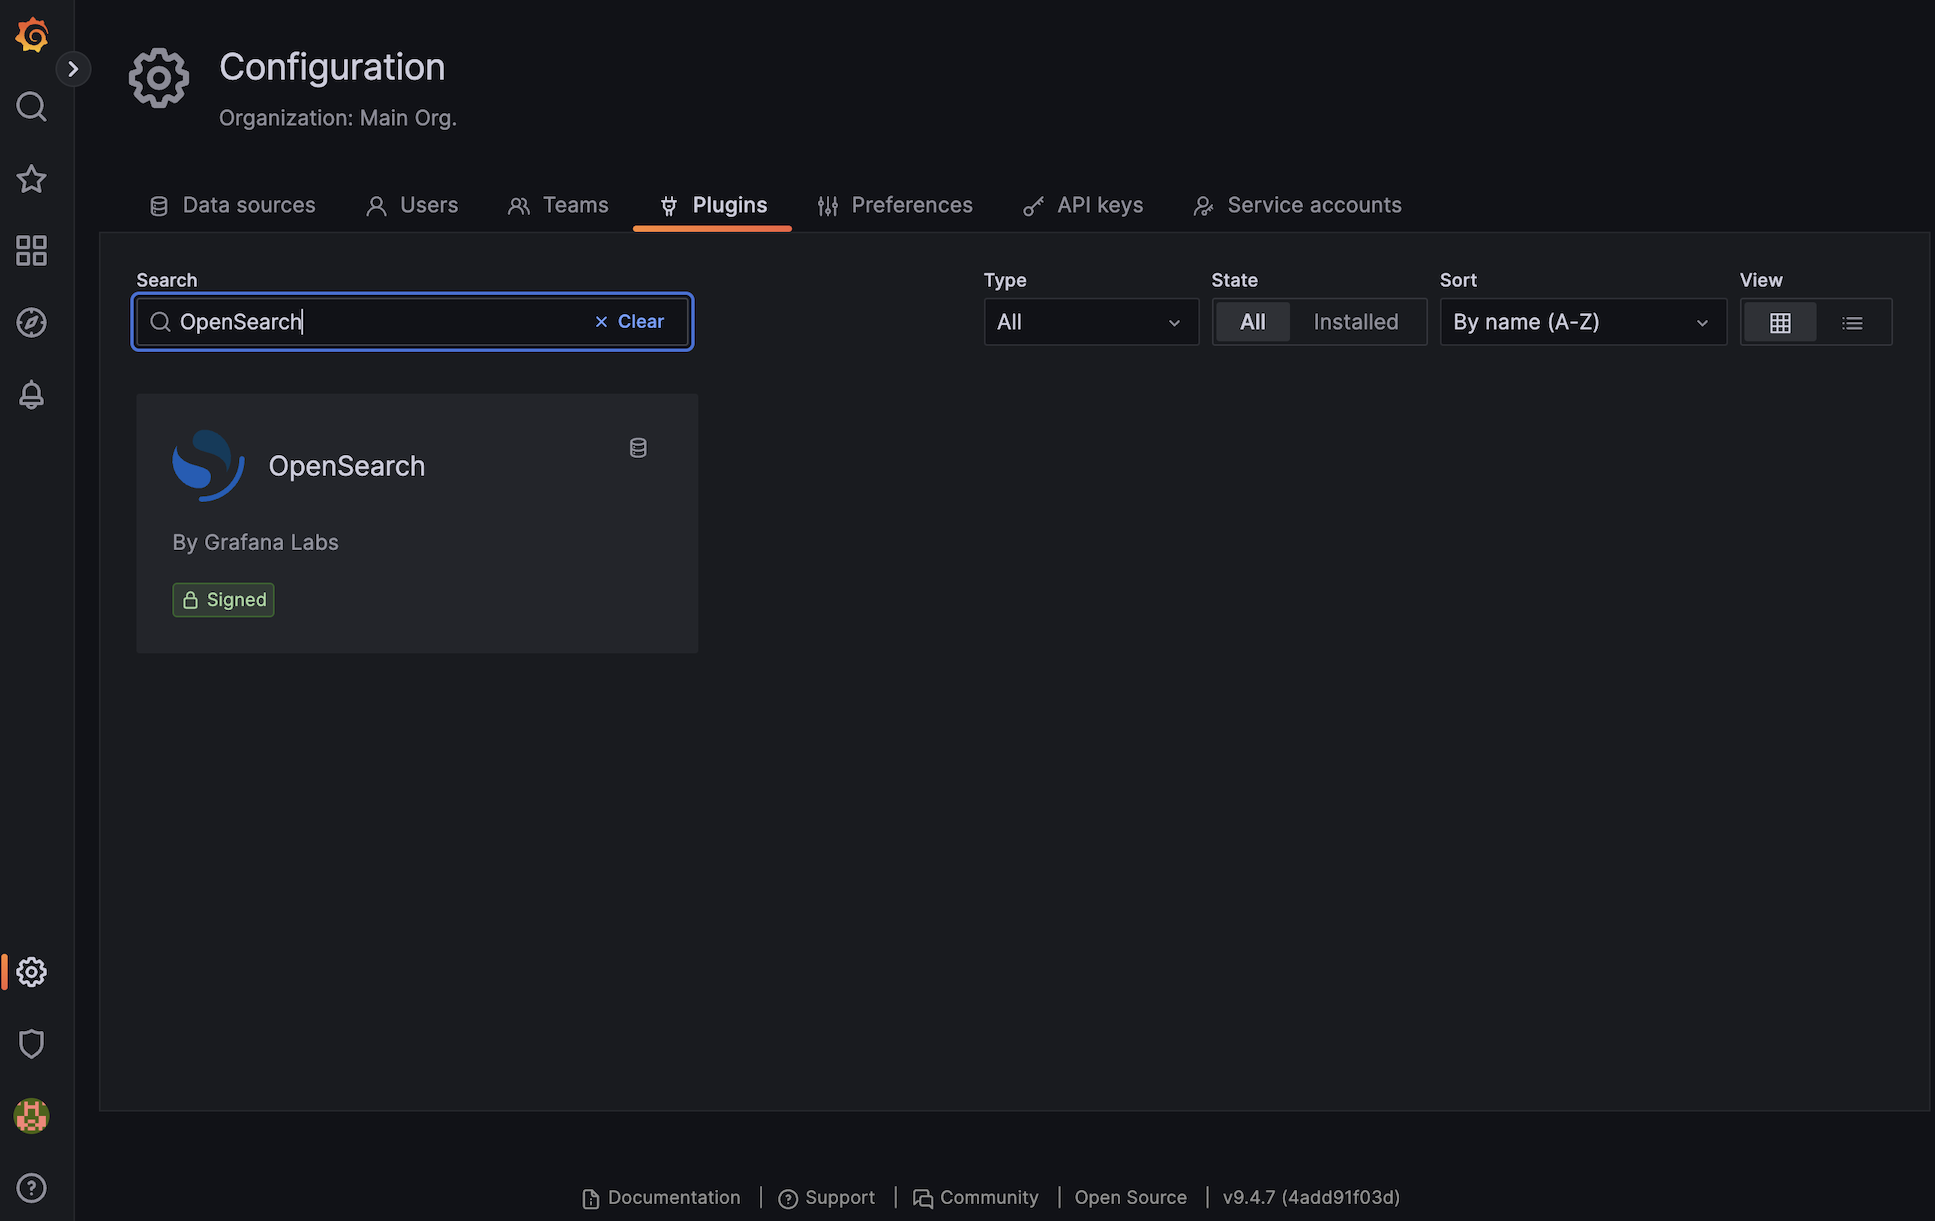
On the page that loads type “OpenSearch” into the “Search” box toward the top.
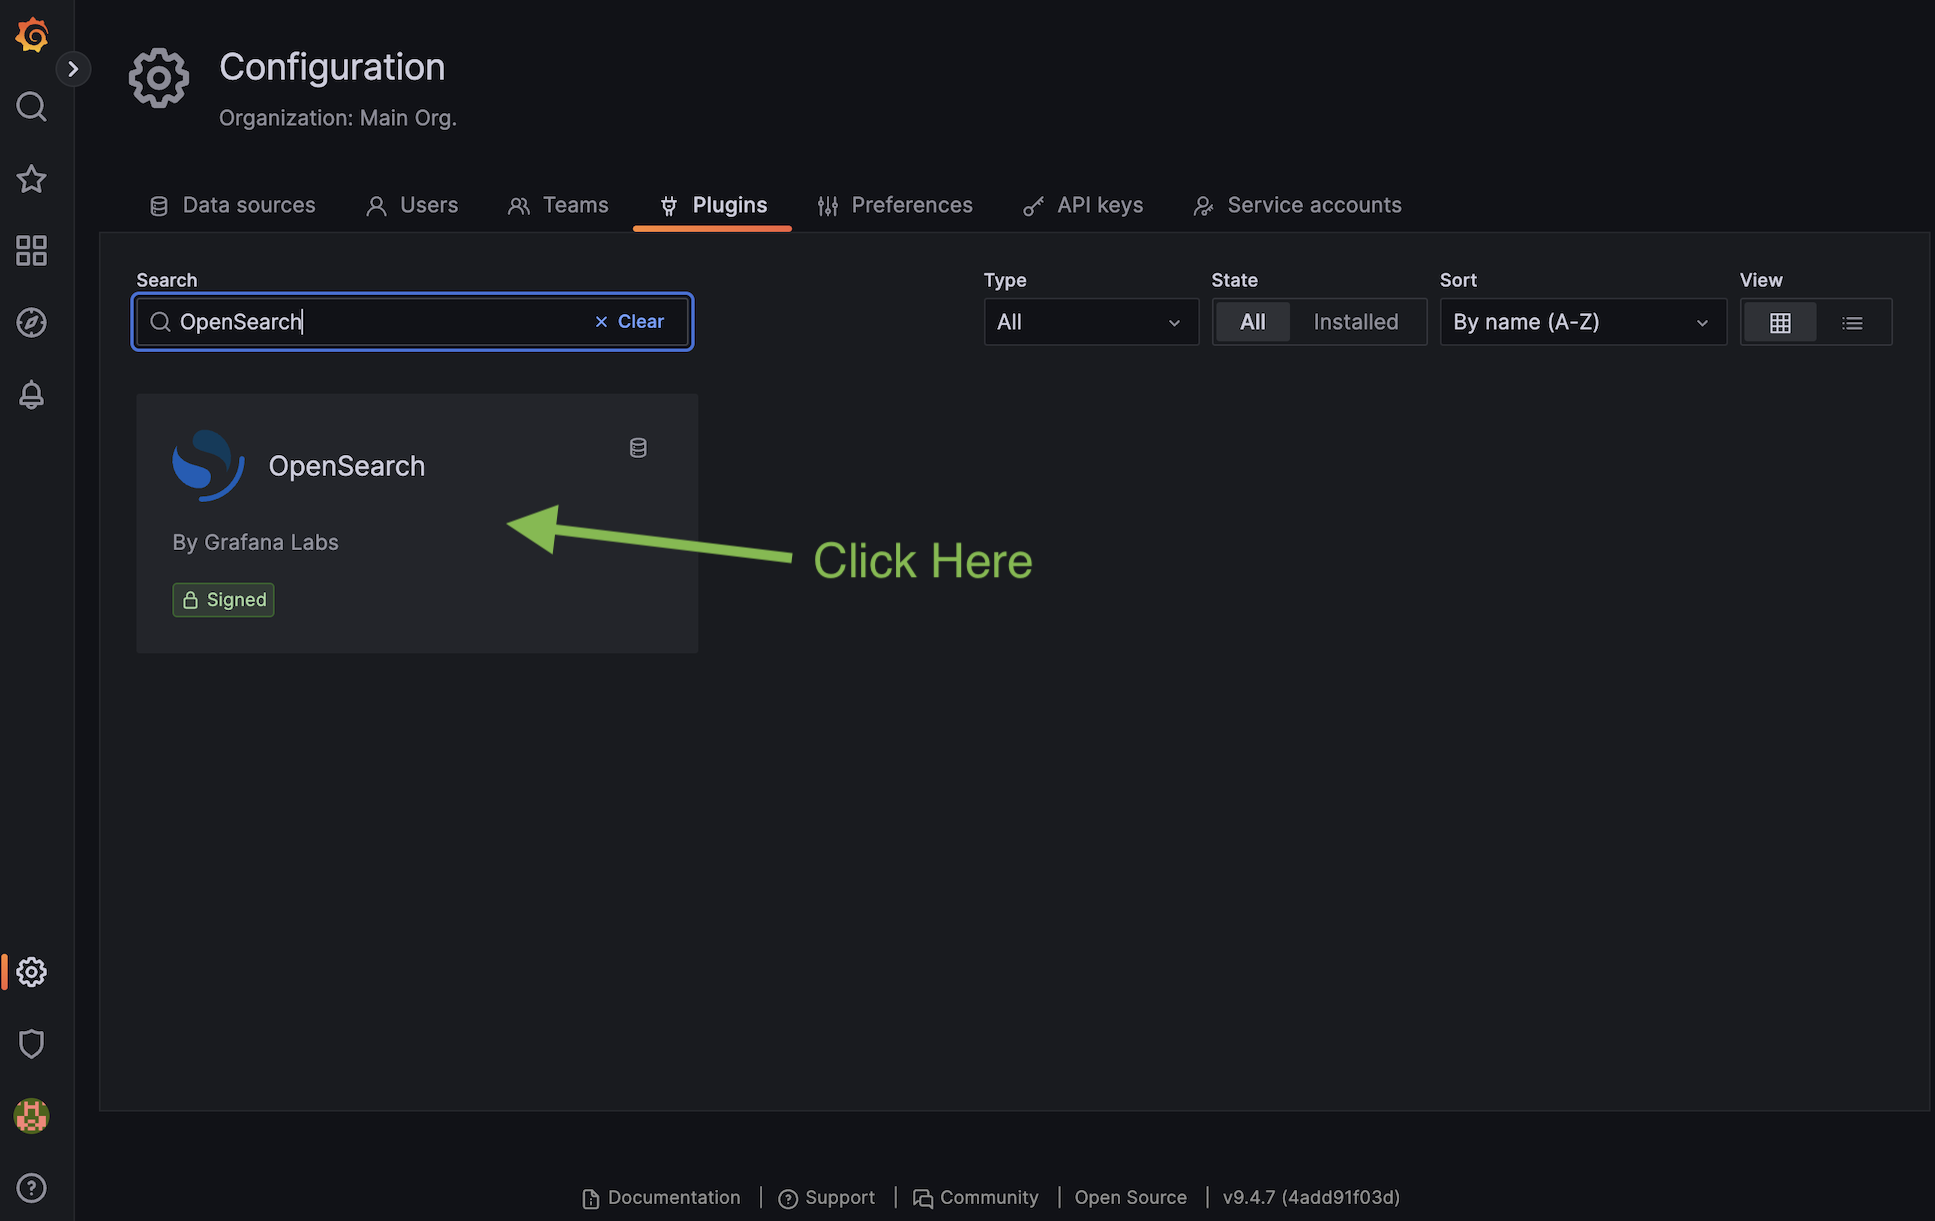
Click on the OpenSearch plugin in the search results.
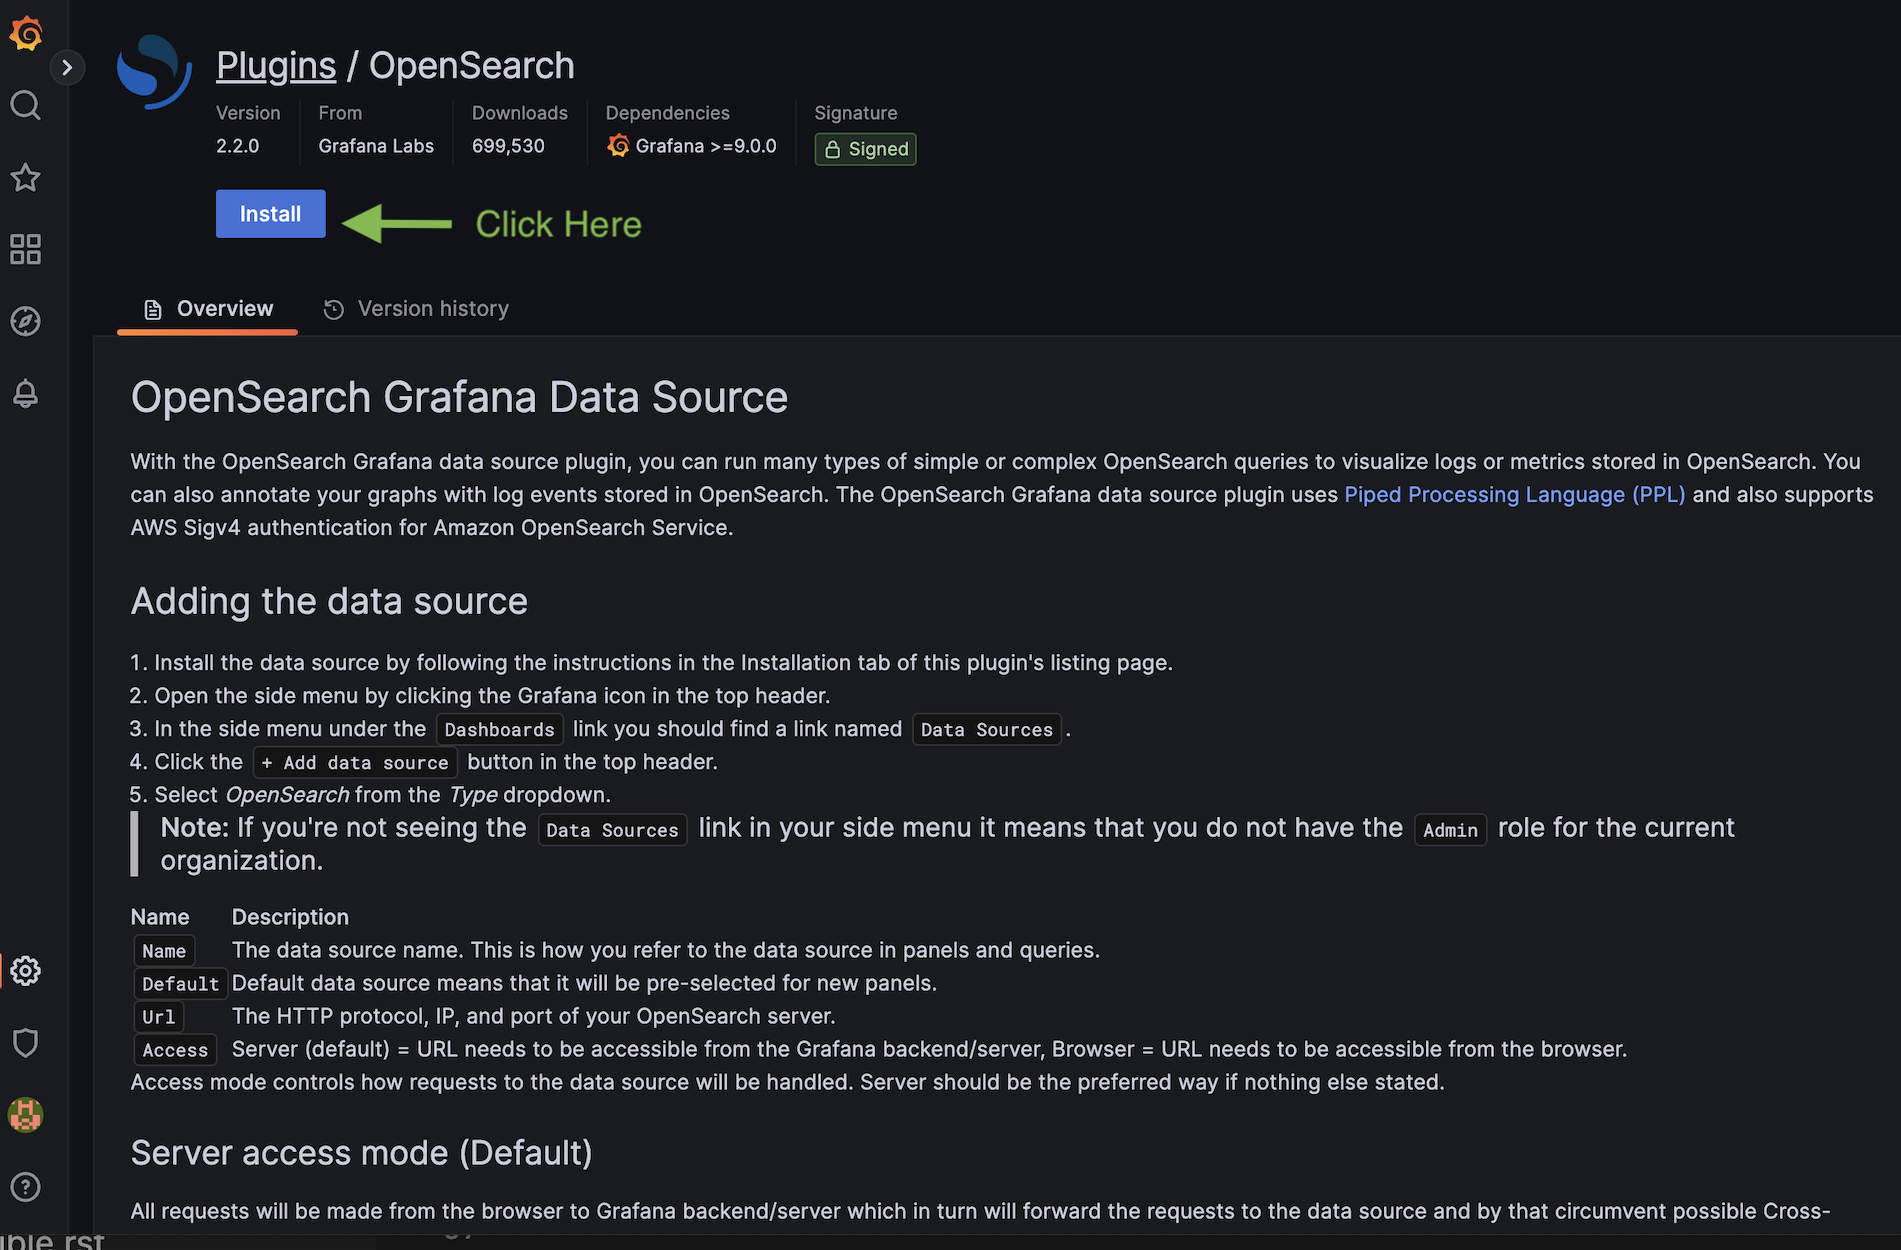
On the page that loads click “Install” and wait for the process to complete. It usually only takes a few seconds.
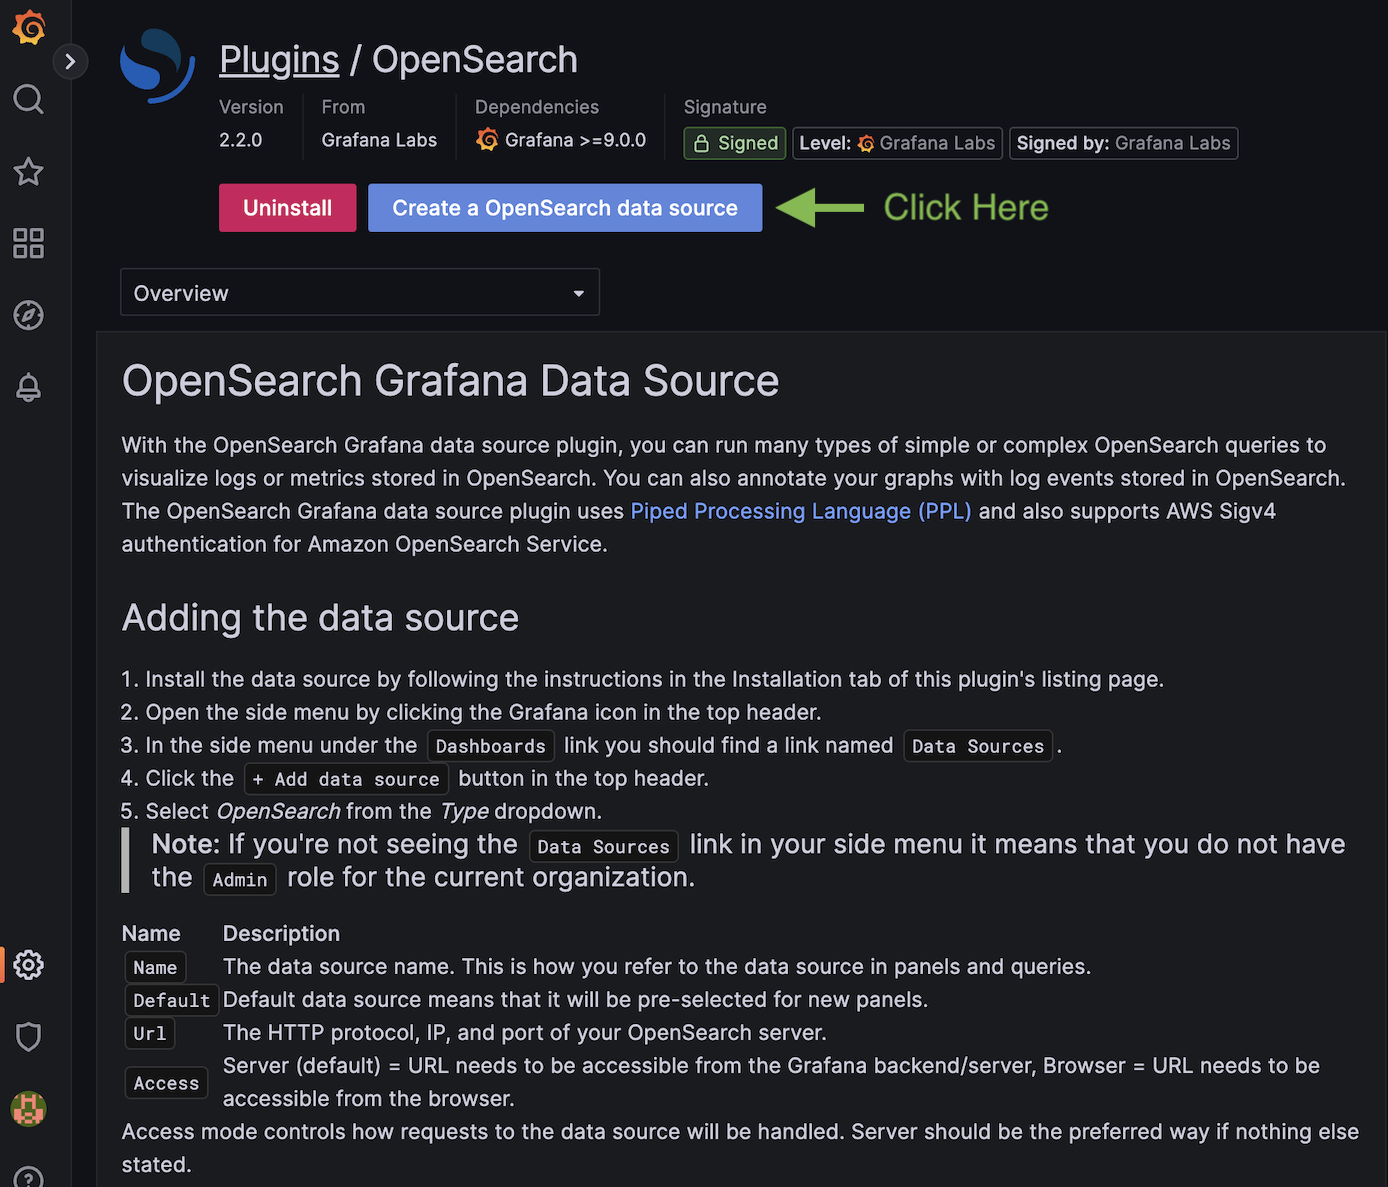
We will now configure Grafana to talk to OpenSearch. Click the “Create a OpenSearch data source” button near the top of page.
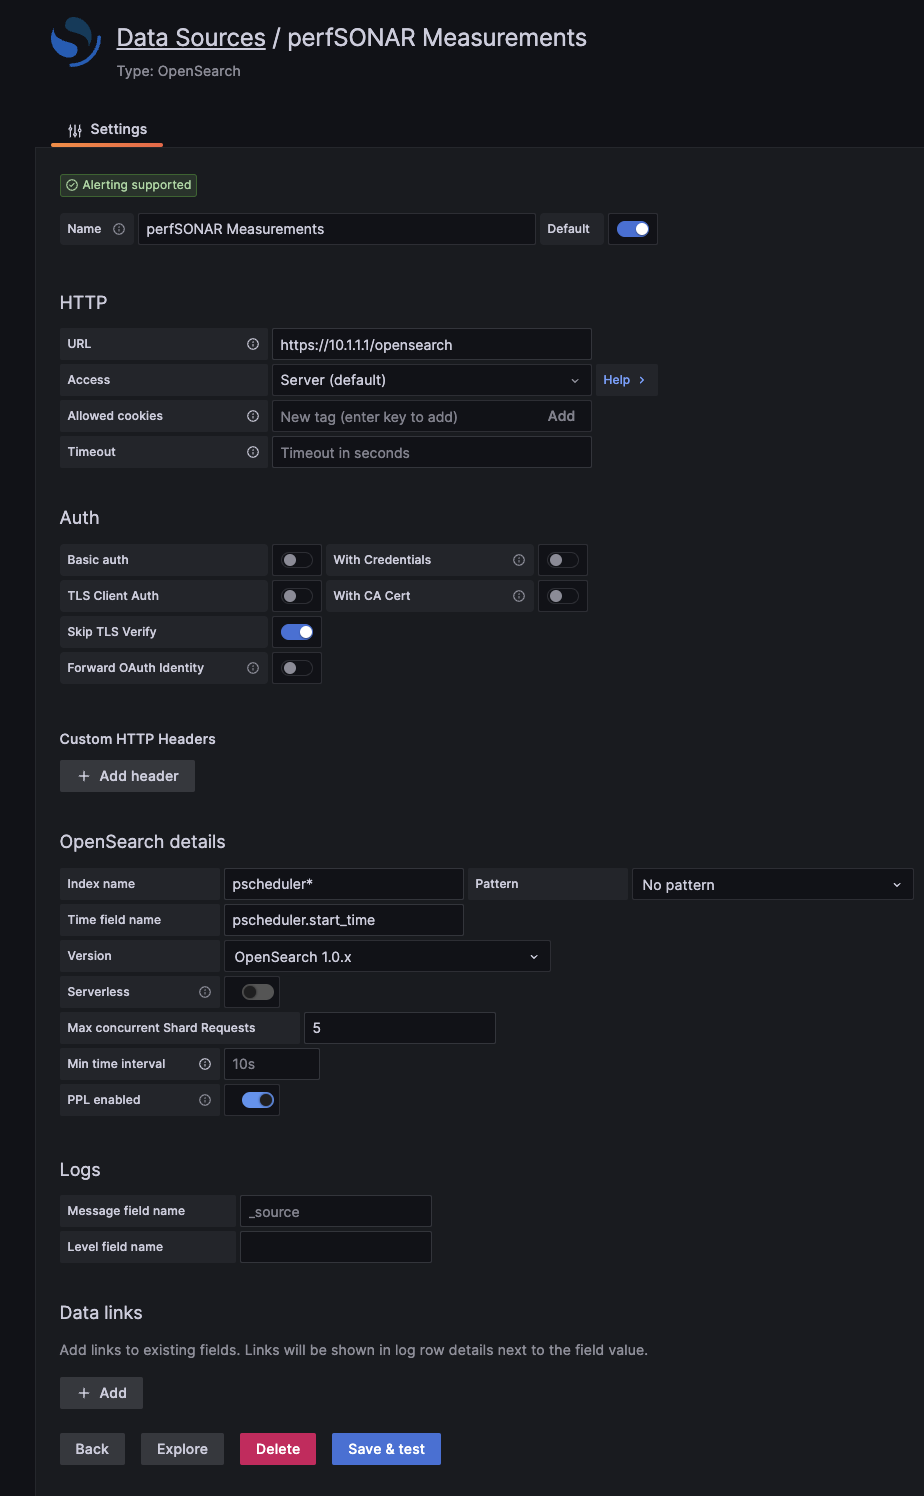
- On the page that loads fill-in the fields with the following (any field not referenced can be left as default).
Name: perfSONAR Measurements
URL: https://PERFSONAR_HOST/opensearch (Replace PERFSONAR_HOST with the address of the host where you have the perfSONAR archive running)
Skip TLS Verify: Enable this toggle since by default perfSONAR installations use self-signed certificate. If you have replaced the default certificate with a trusted certificate then you can leave this disabled.
Index name: pscheduler*
Time field name: pscheduler.start_time
Example screenshot below using a Toolkit at address 10.1.1.1 (Note: Hostnames are fine to use instead of IPs if applicable):
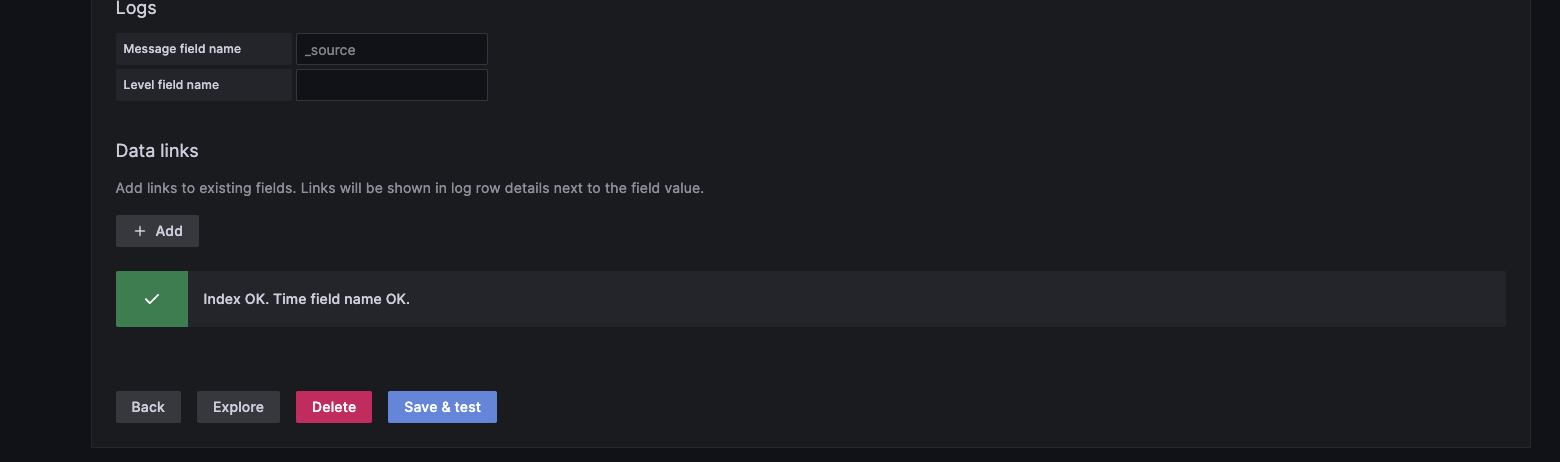
Click “Save & test”. You should see a message like below if it worked. If you get an error, check the settings above and verify you are able to reach the target perfSONAR host from your Grafana host.
Congratulations, you now have a Grafana instance talking to your perfSONAR Archive. The next steps will progress you toward displaying some data.
Step 3: Install the Matrix Plugin
In this step you will install another Grafana plug-in, but instead of being a plug-in that allows you to talk to a data source, it is a plugin that will allow you to include a new type of visualization in your dashboard. In this case, it is the matrix panel that is useful for summarizing tests.
Hover over the Settings icon on the left (looks like a cog wheel) and select “Plugins” from the menu.
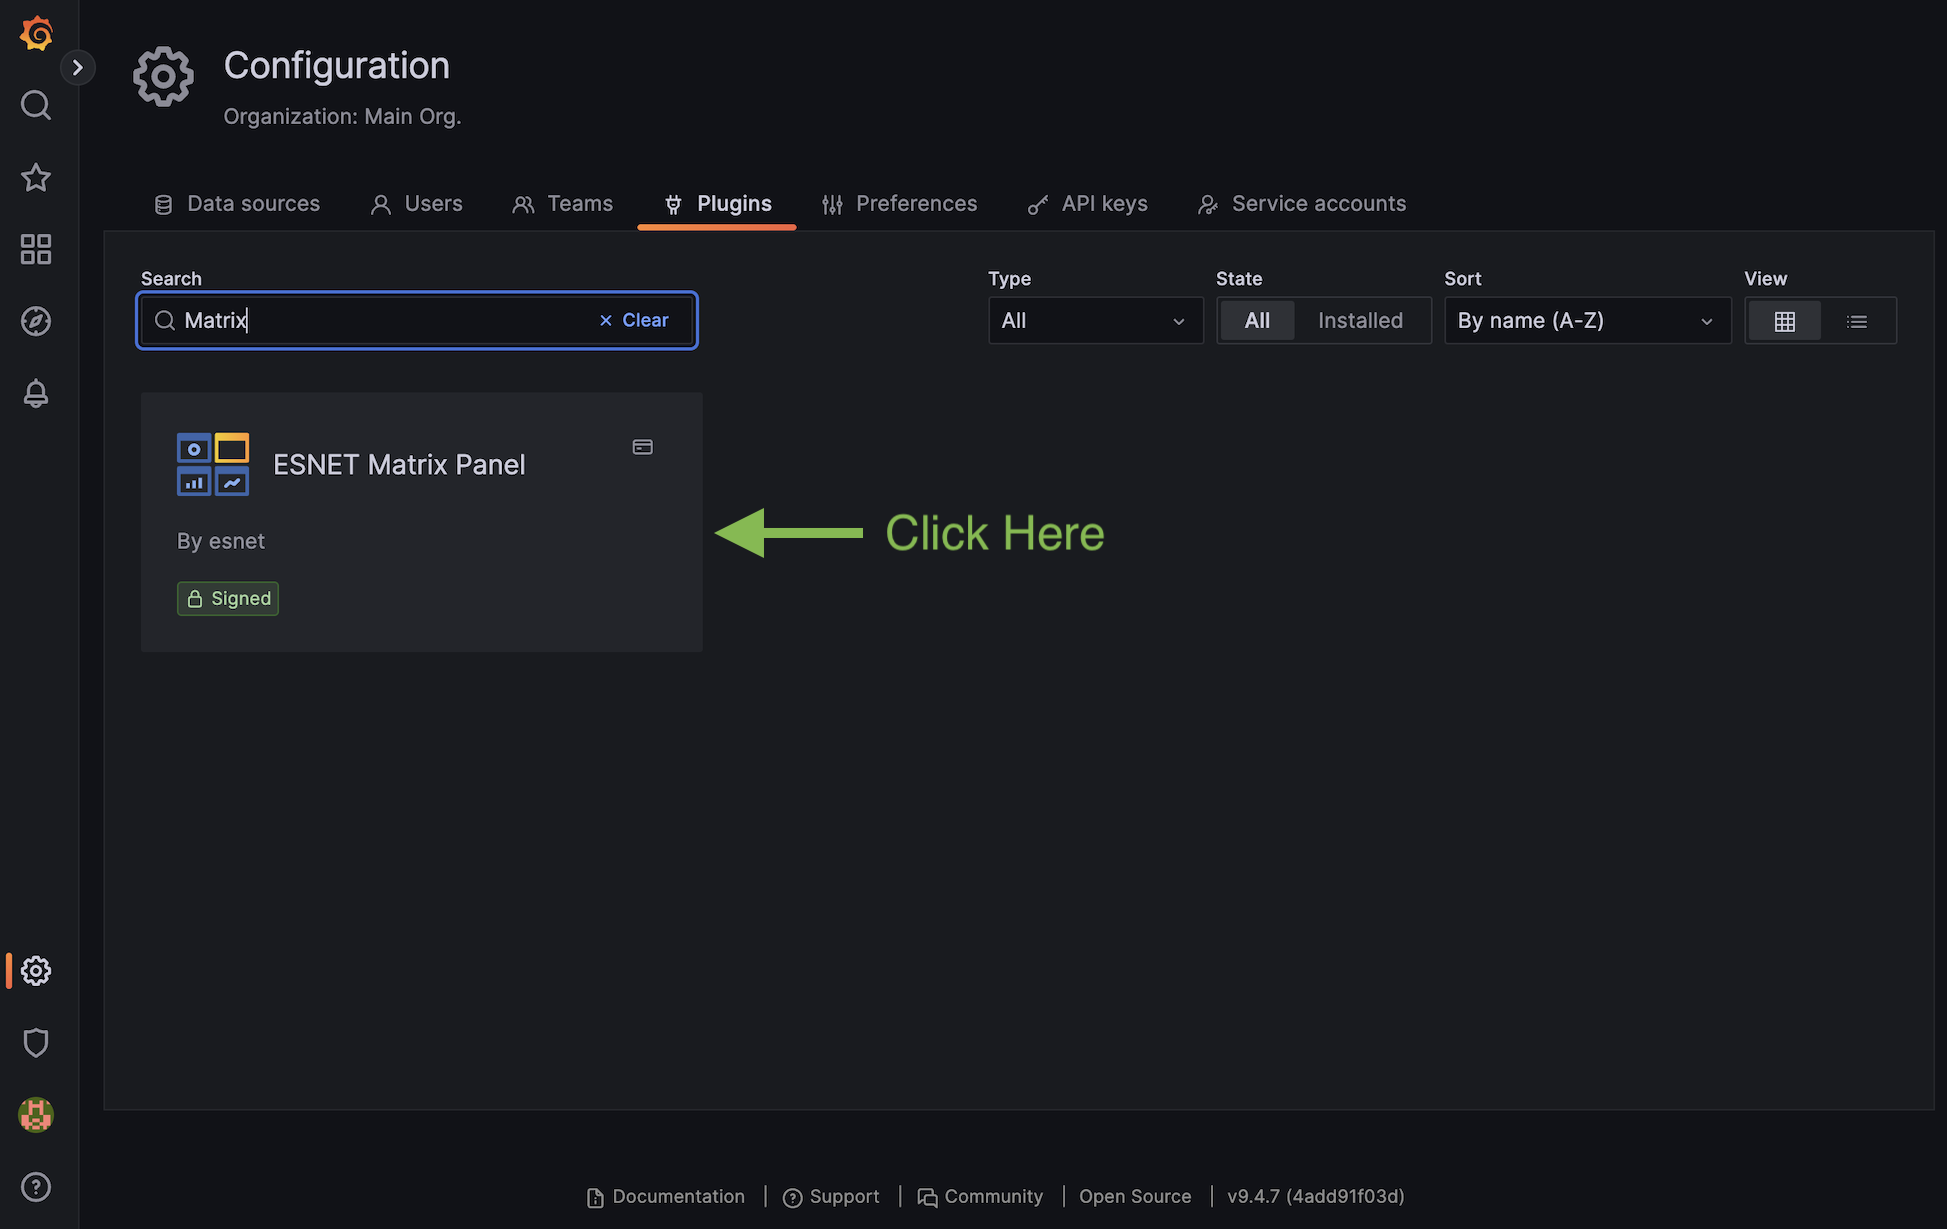
On the page that loads type “Matrix” into the “Search” box toward the top.
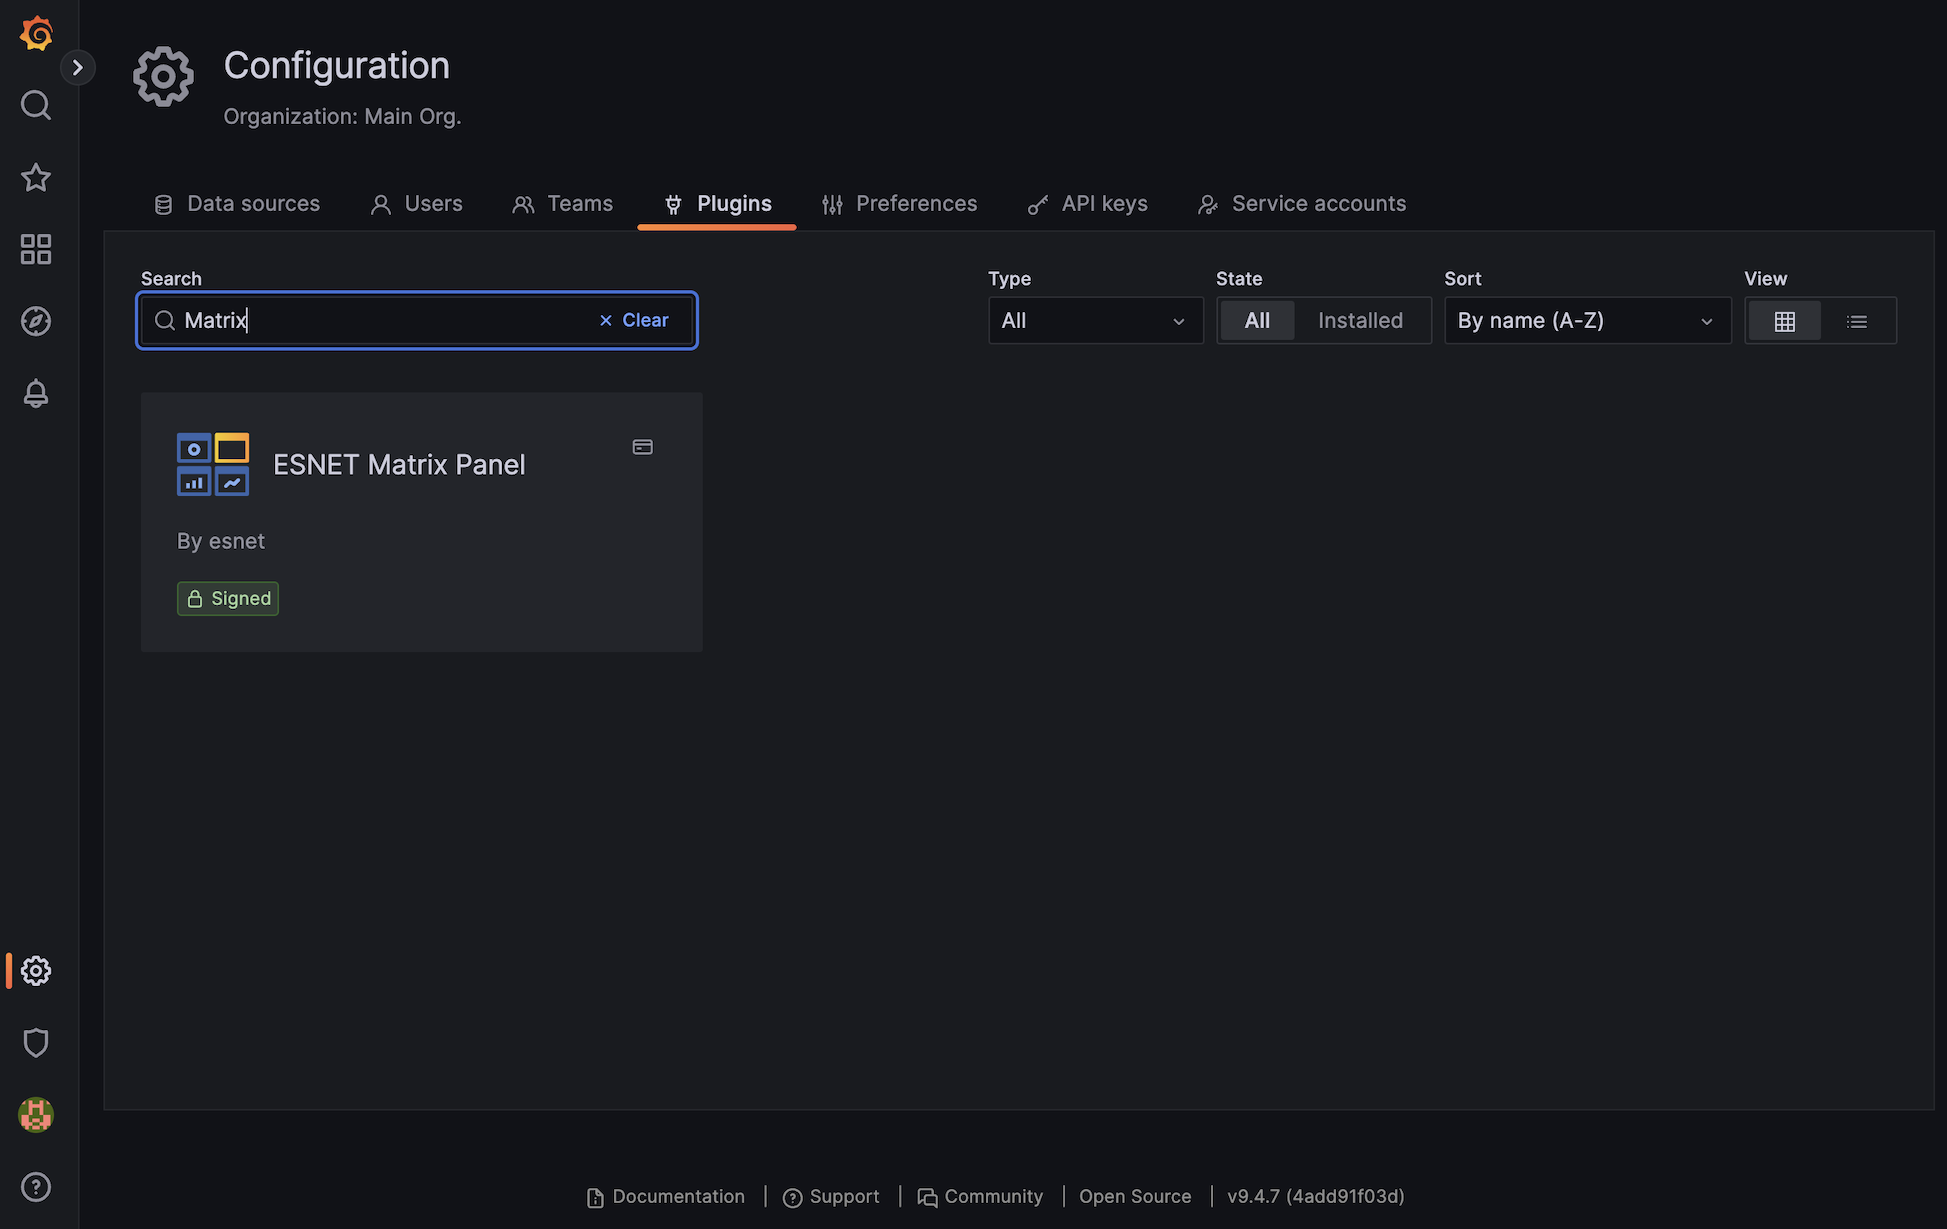
Click on the “ESNET Matrix Panel” plugin in the search results.
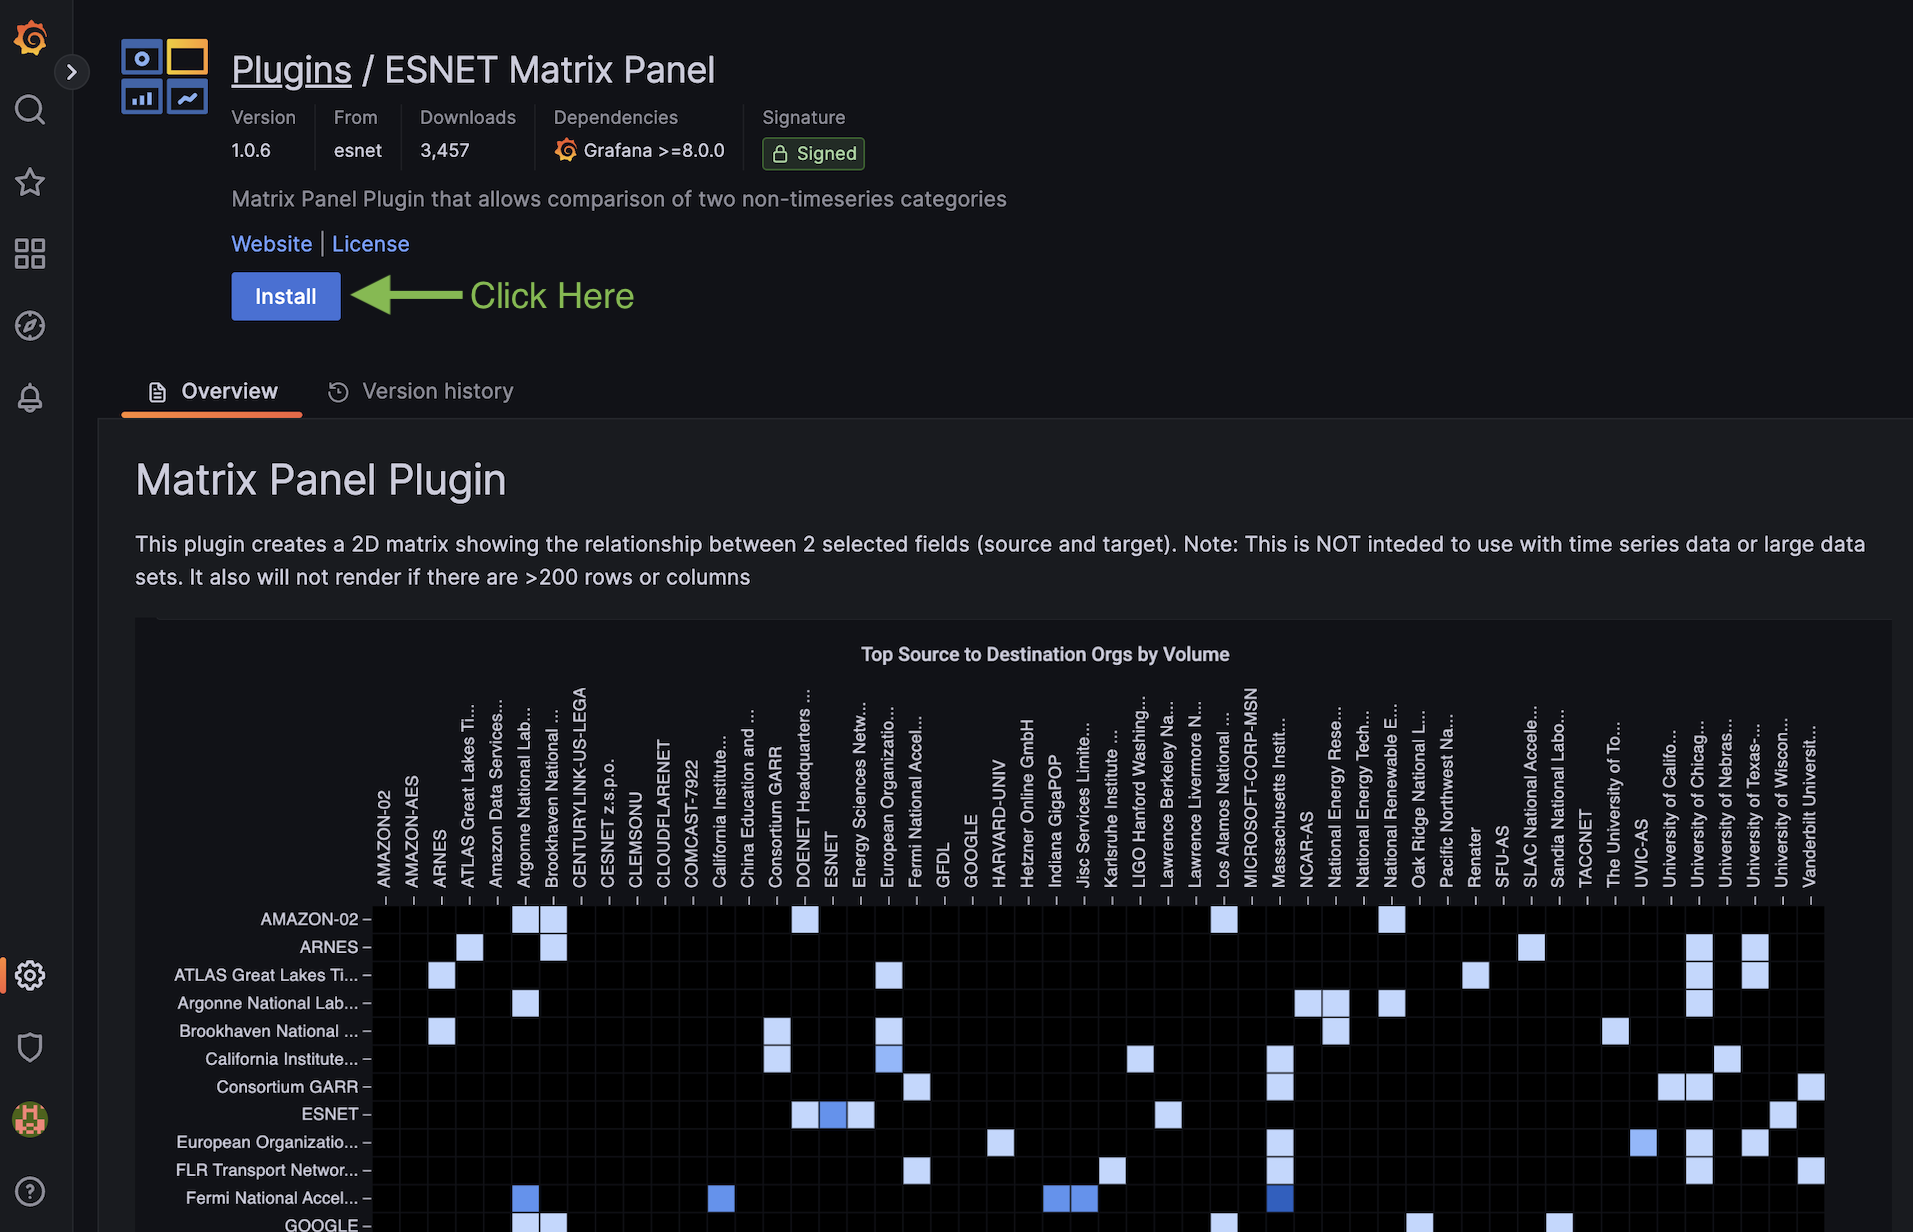
On the page that loads click “Install” and wait for the process to complete. It usually takes a few seconds to a minute. We are now ready to import some dashboards.
Step 4: Import Dashboards
This step will walkthrough how to import a pre-existing set of dashboards provided by the perfSONAR development team. You can always create your own (we’ll cover that in the next step), but these provide a quick way to start playing with data. They can also be used as a reference for when you want to create your own. The steps are as follows:
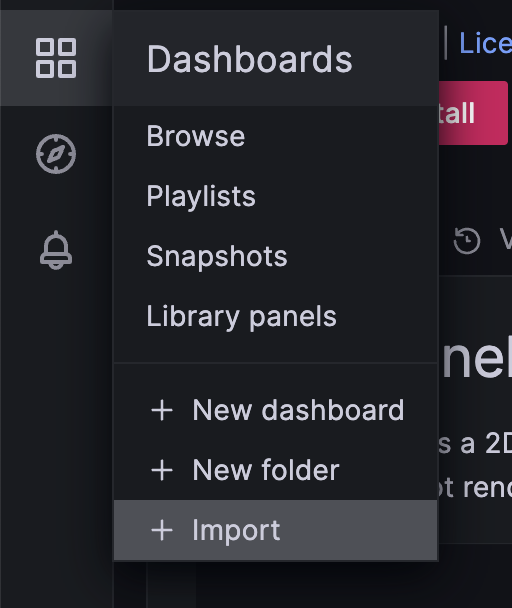
In the Grafana Menu on the left (not the top), hover over the “four square” icon and select “+ Import”.
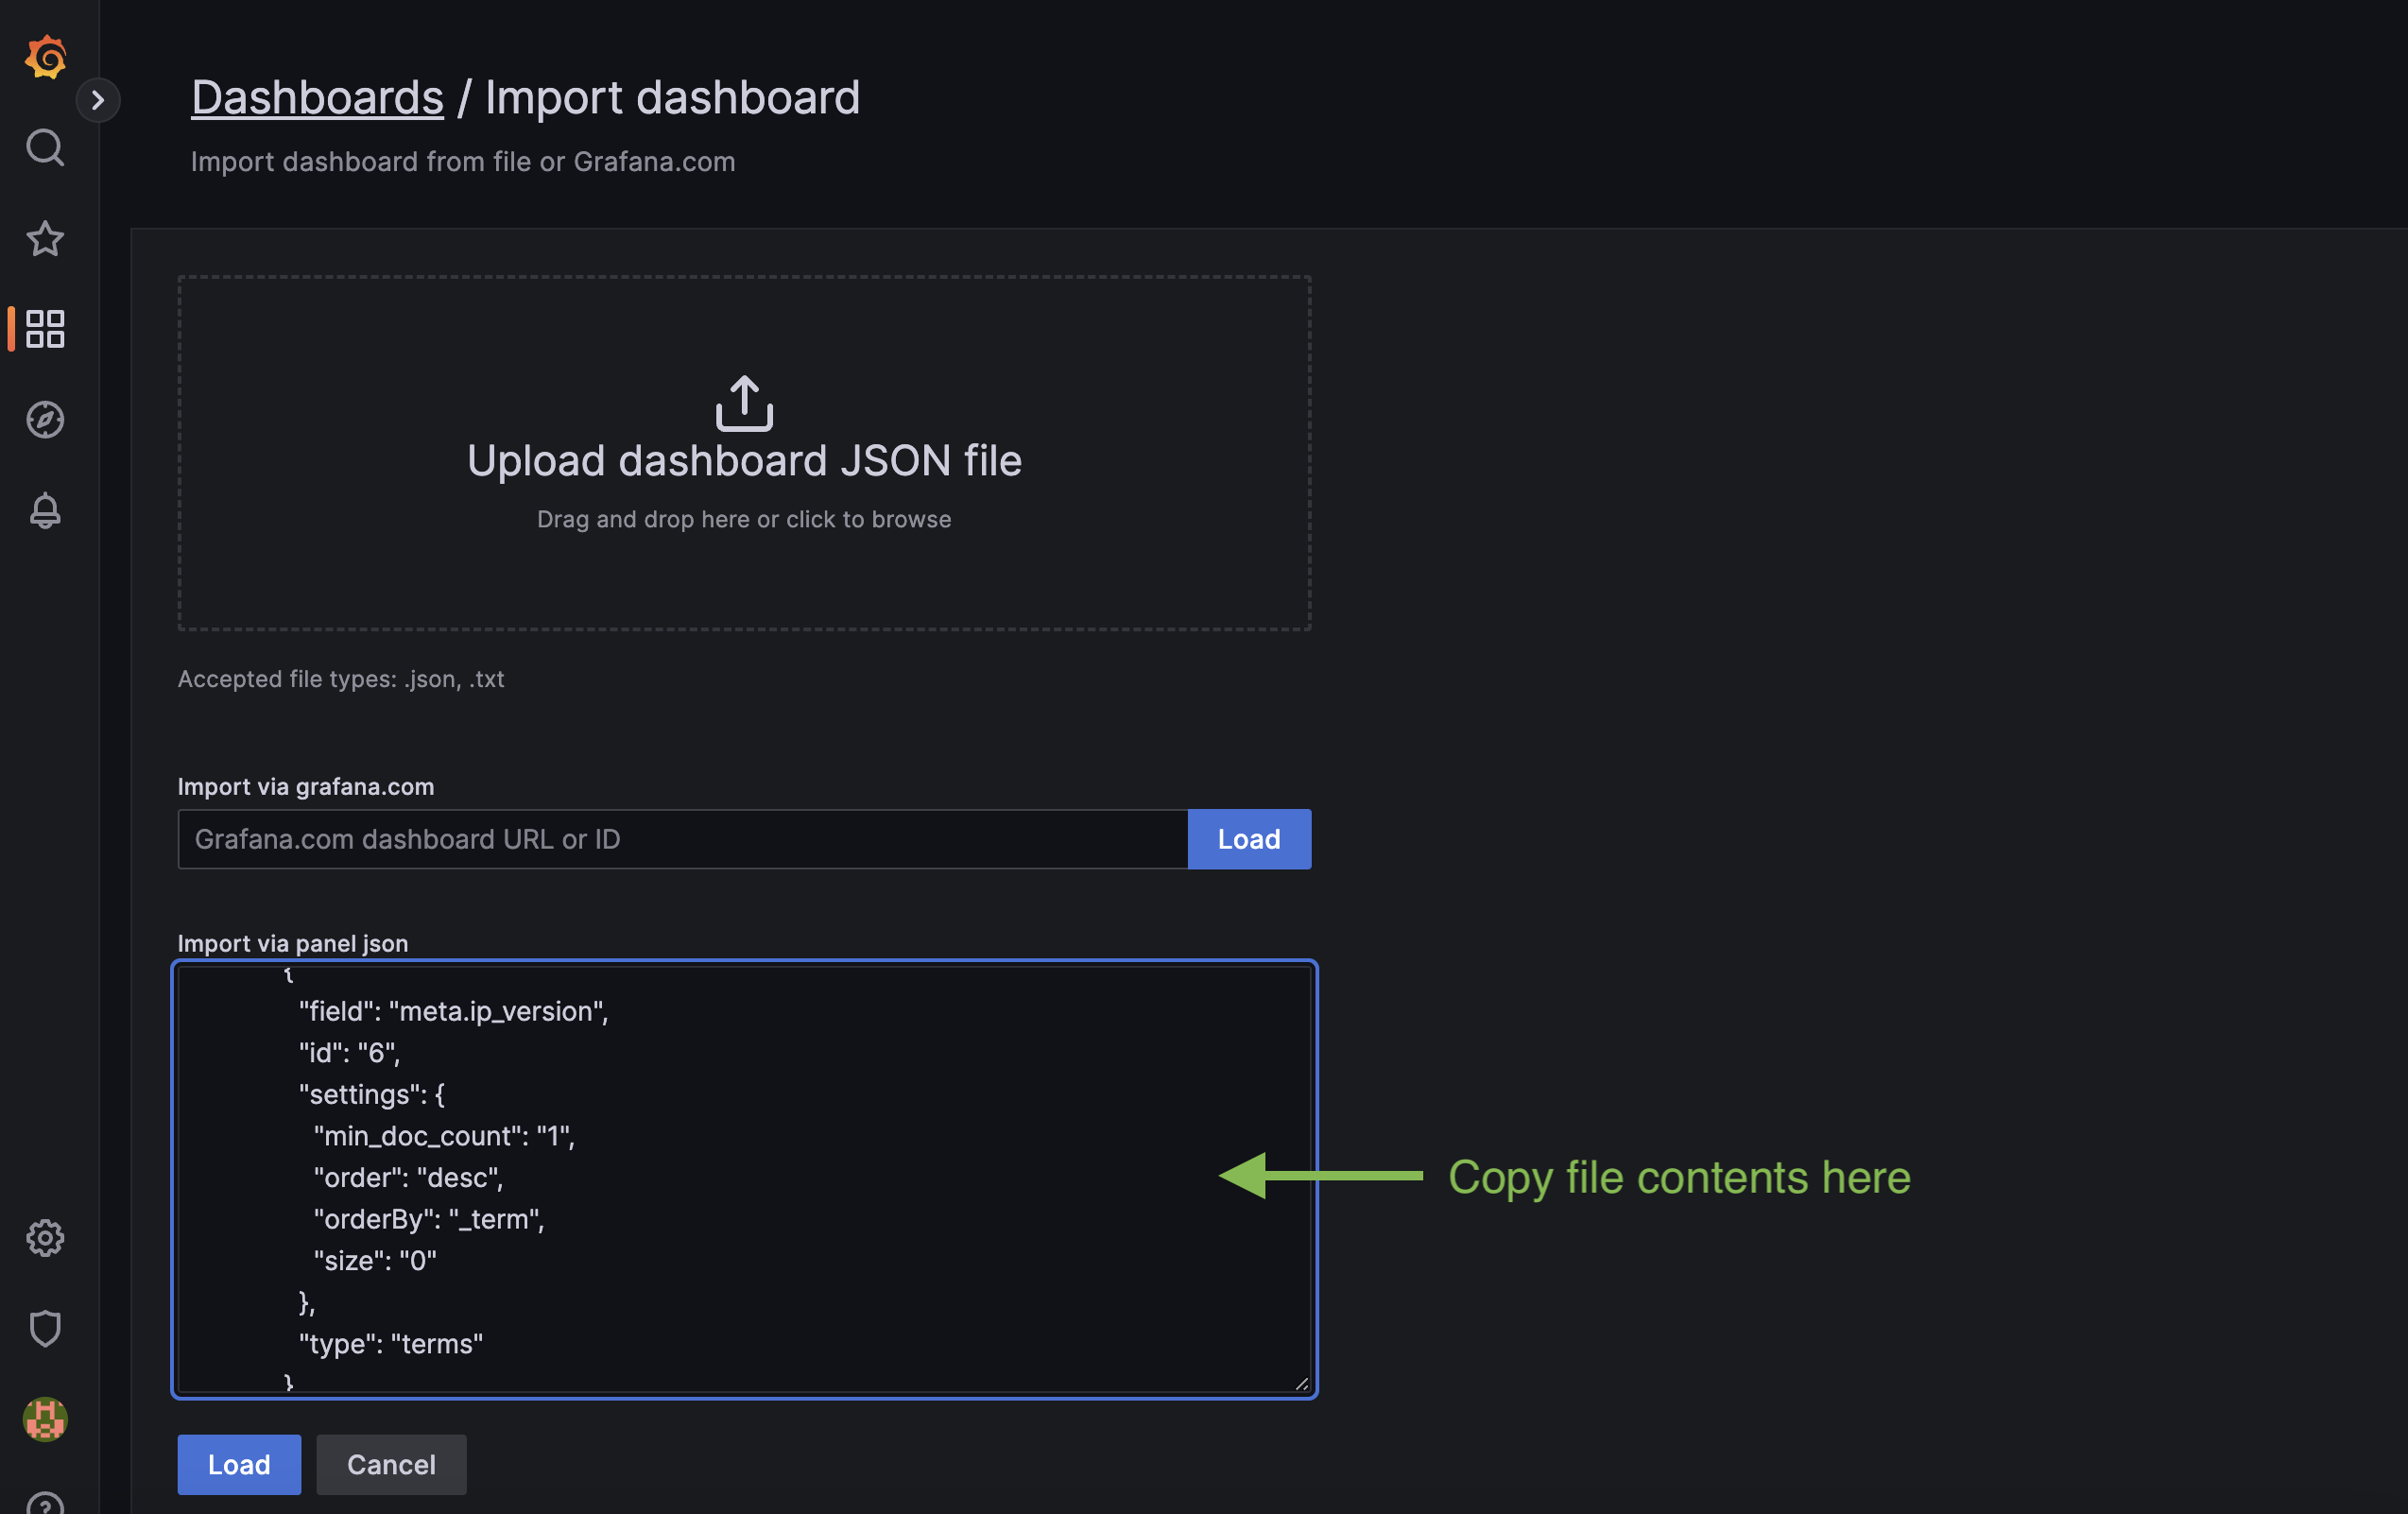
On the page that loads copy and paste the contents of the file perfSONAR Overview Grafana Dashboard JSON into the textbox labeled “Import via panel json”.
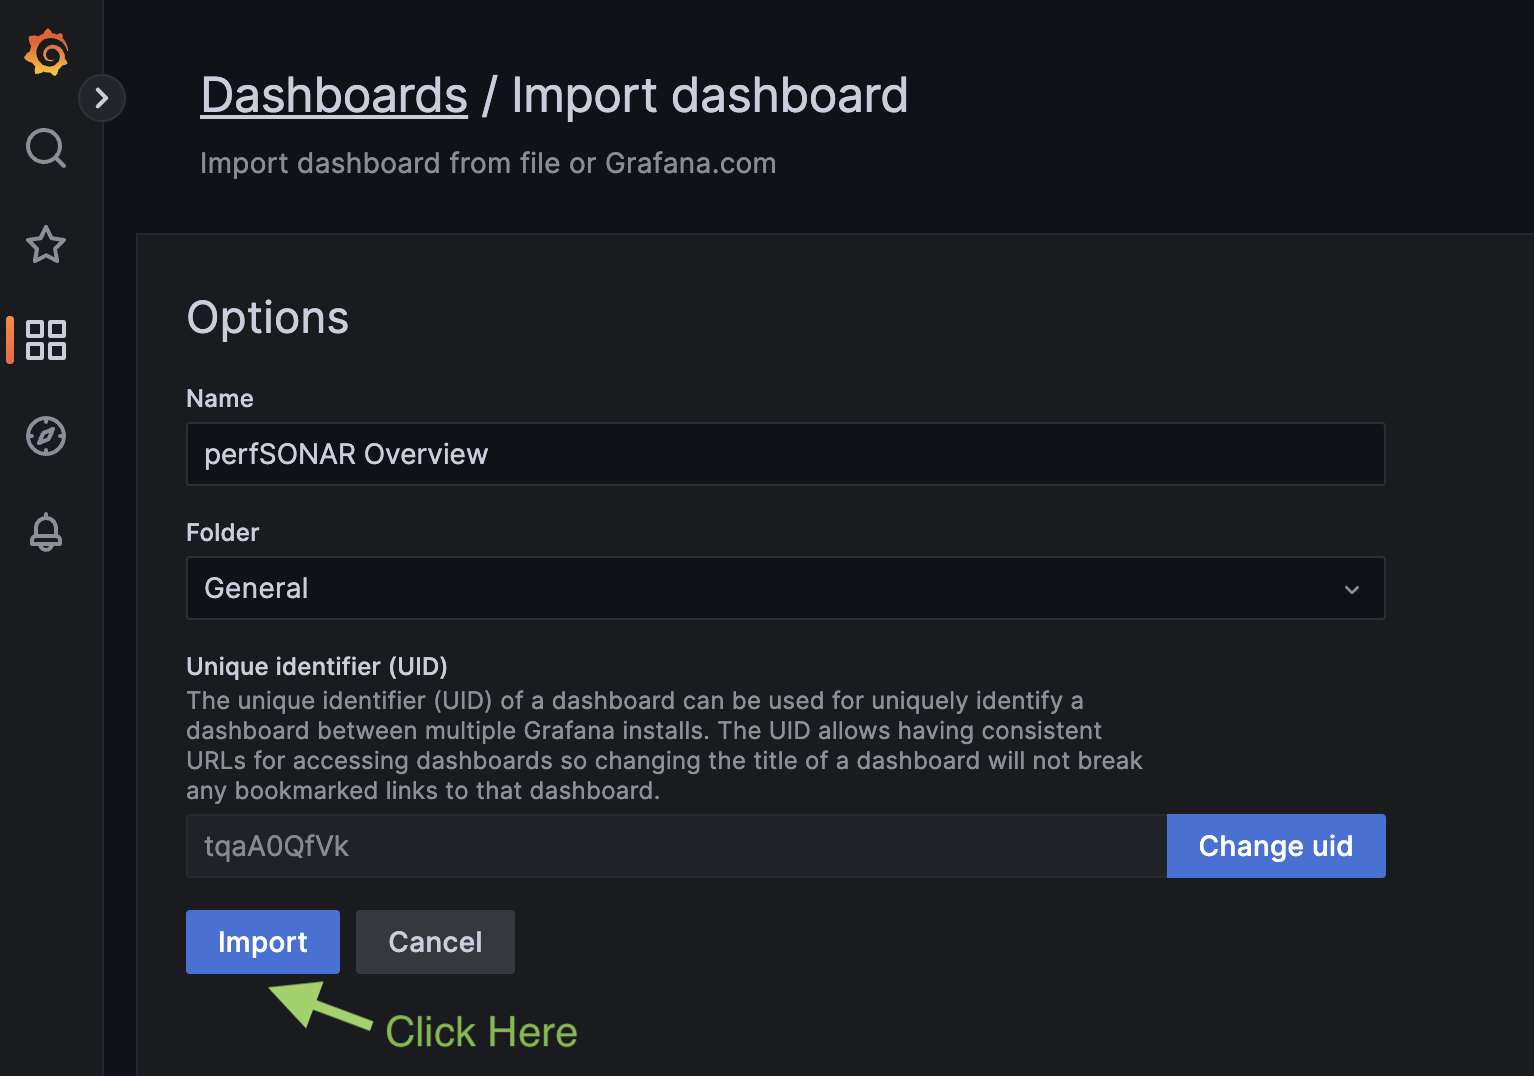
On the next page you do not need to change any settings, just click “Import”
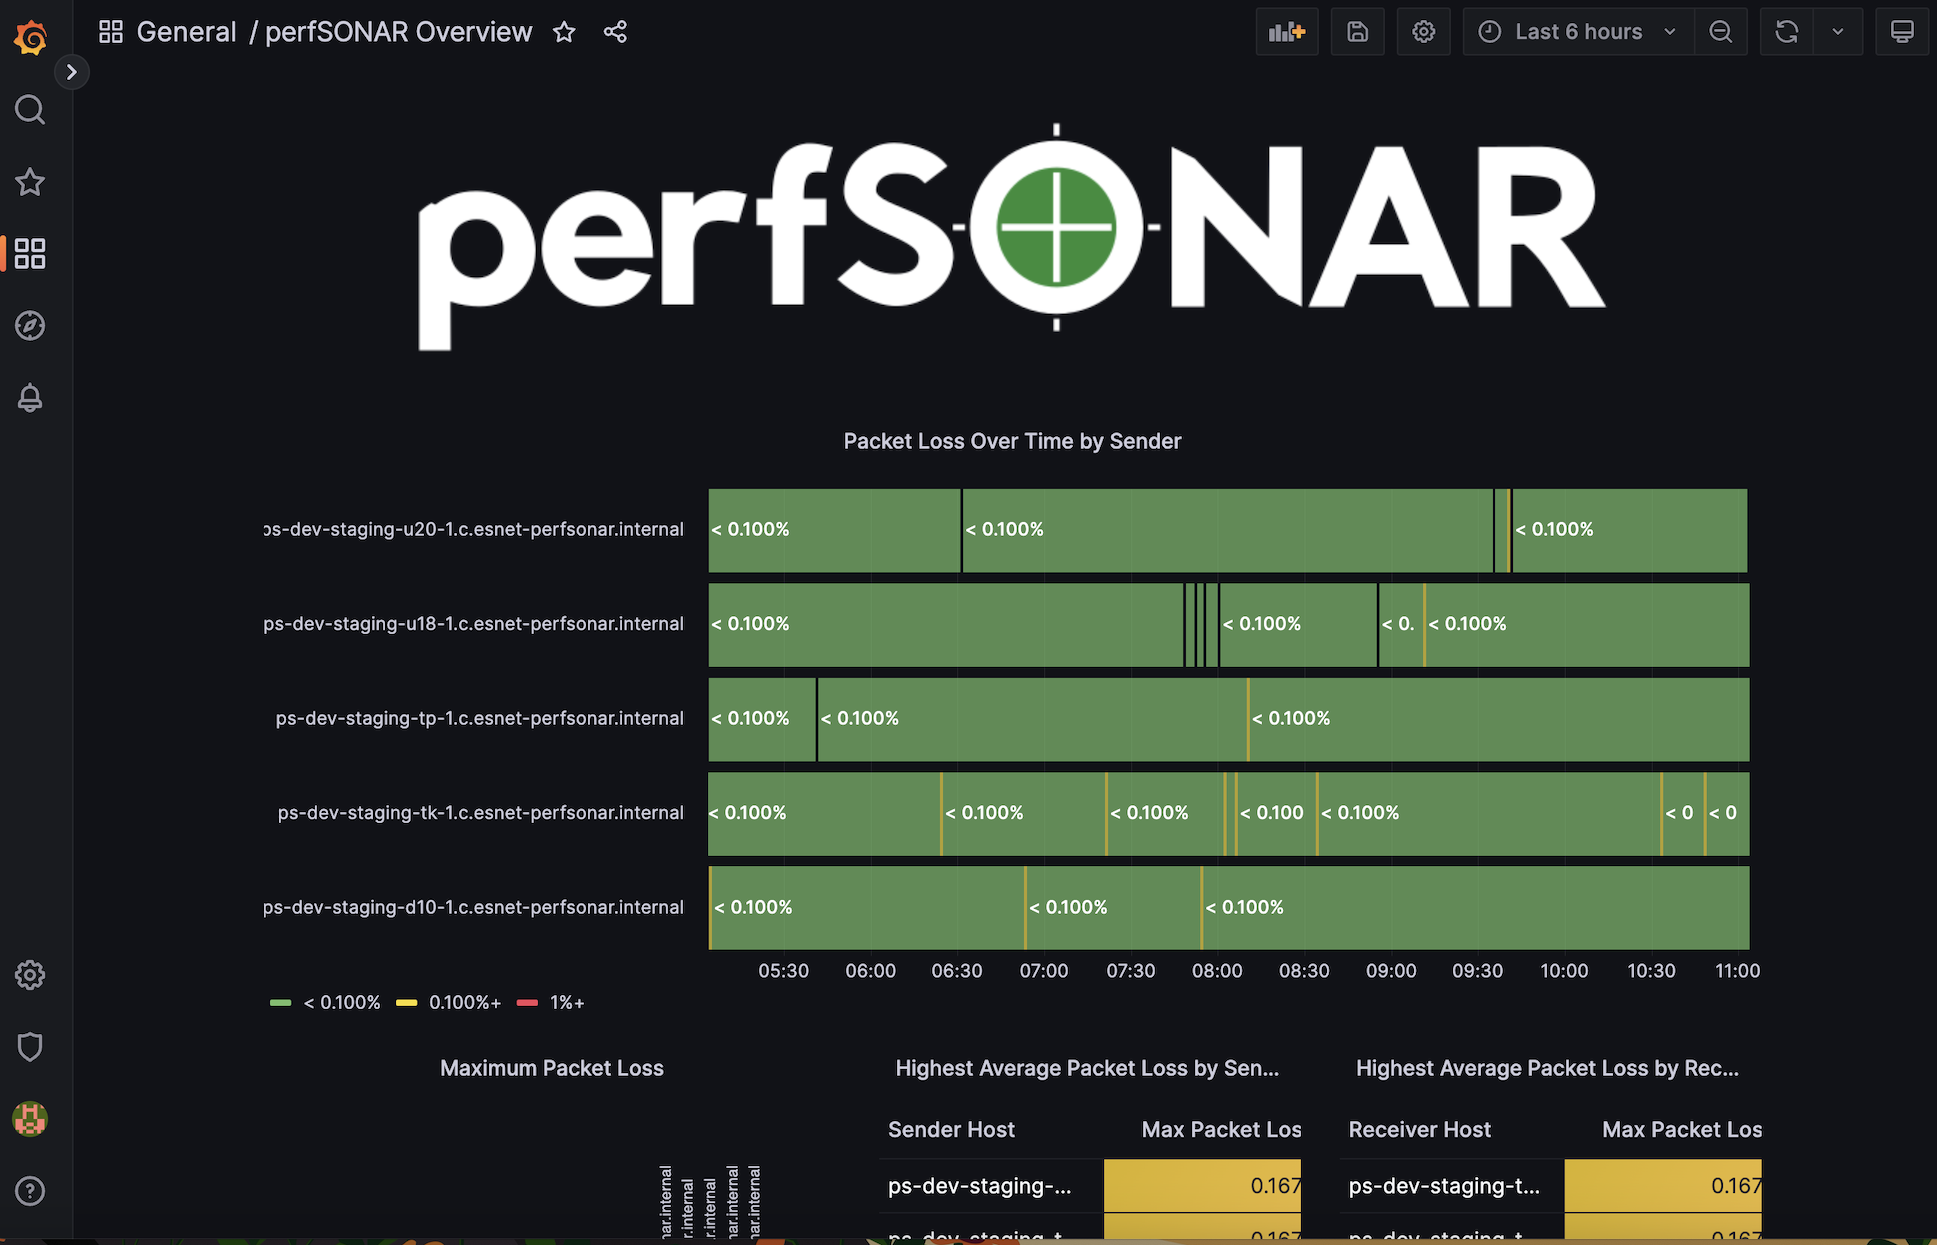
You will now have an overview page that looks like the below:
You can explore the visualization on the page. You’ll notice that you can click on the boxes on the grids displayed, but the dashboard they point to does not exist. Let’s import that dashboard as well. In the Grafana Menu on the left (not the top), hover over the “four square” icon and select “+ Import”.
On the page that loads copy and paste the contents of the file perfSONAR Endpoint Pair Grafana Dashboard JSON into the textbox labeled “Import via panel json”.
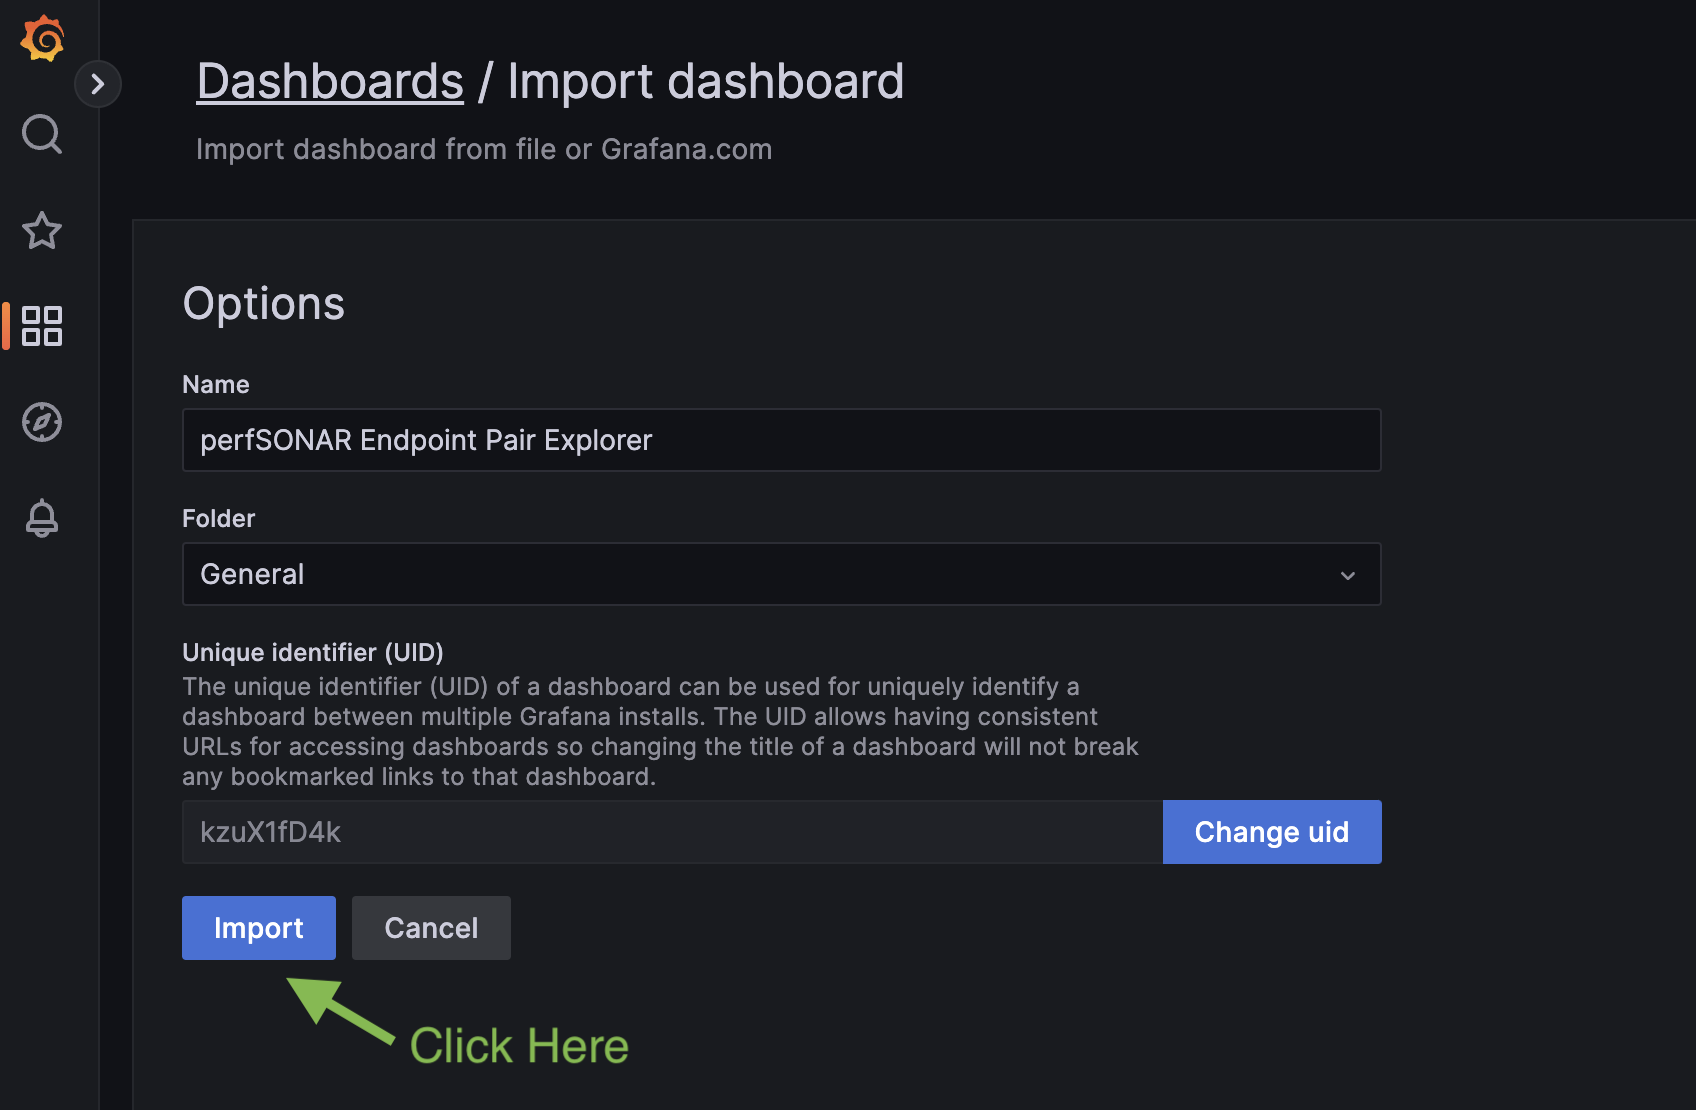
On the next page you do not need to change any settings, just click “Import”
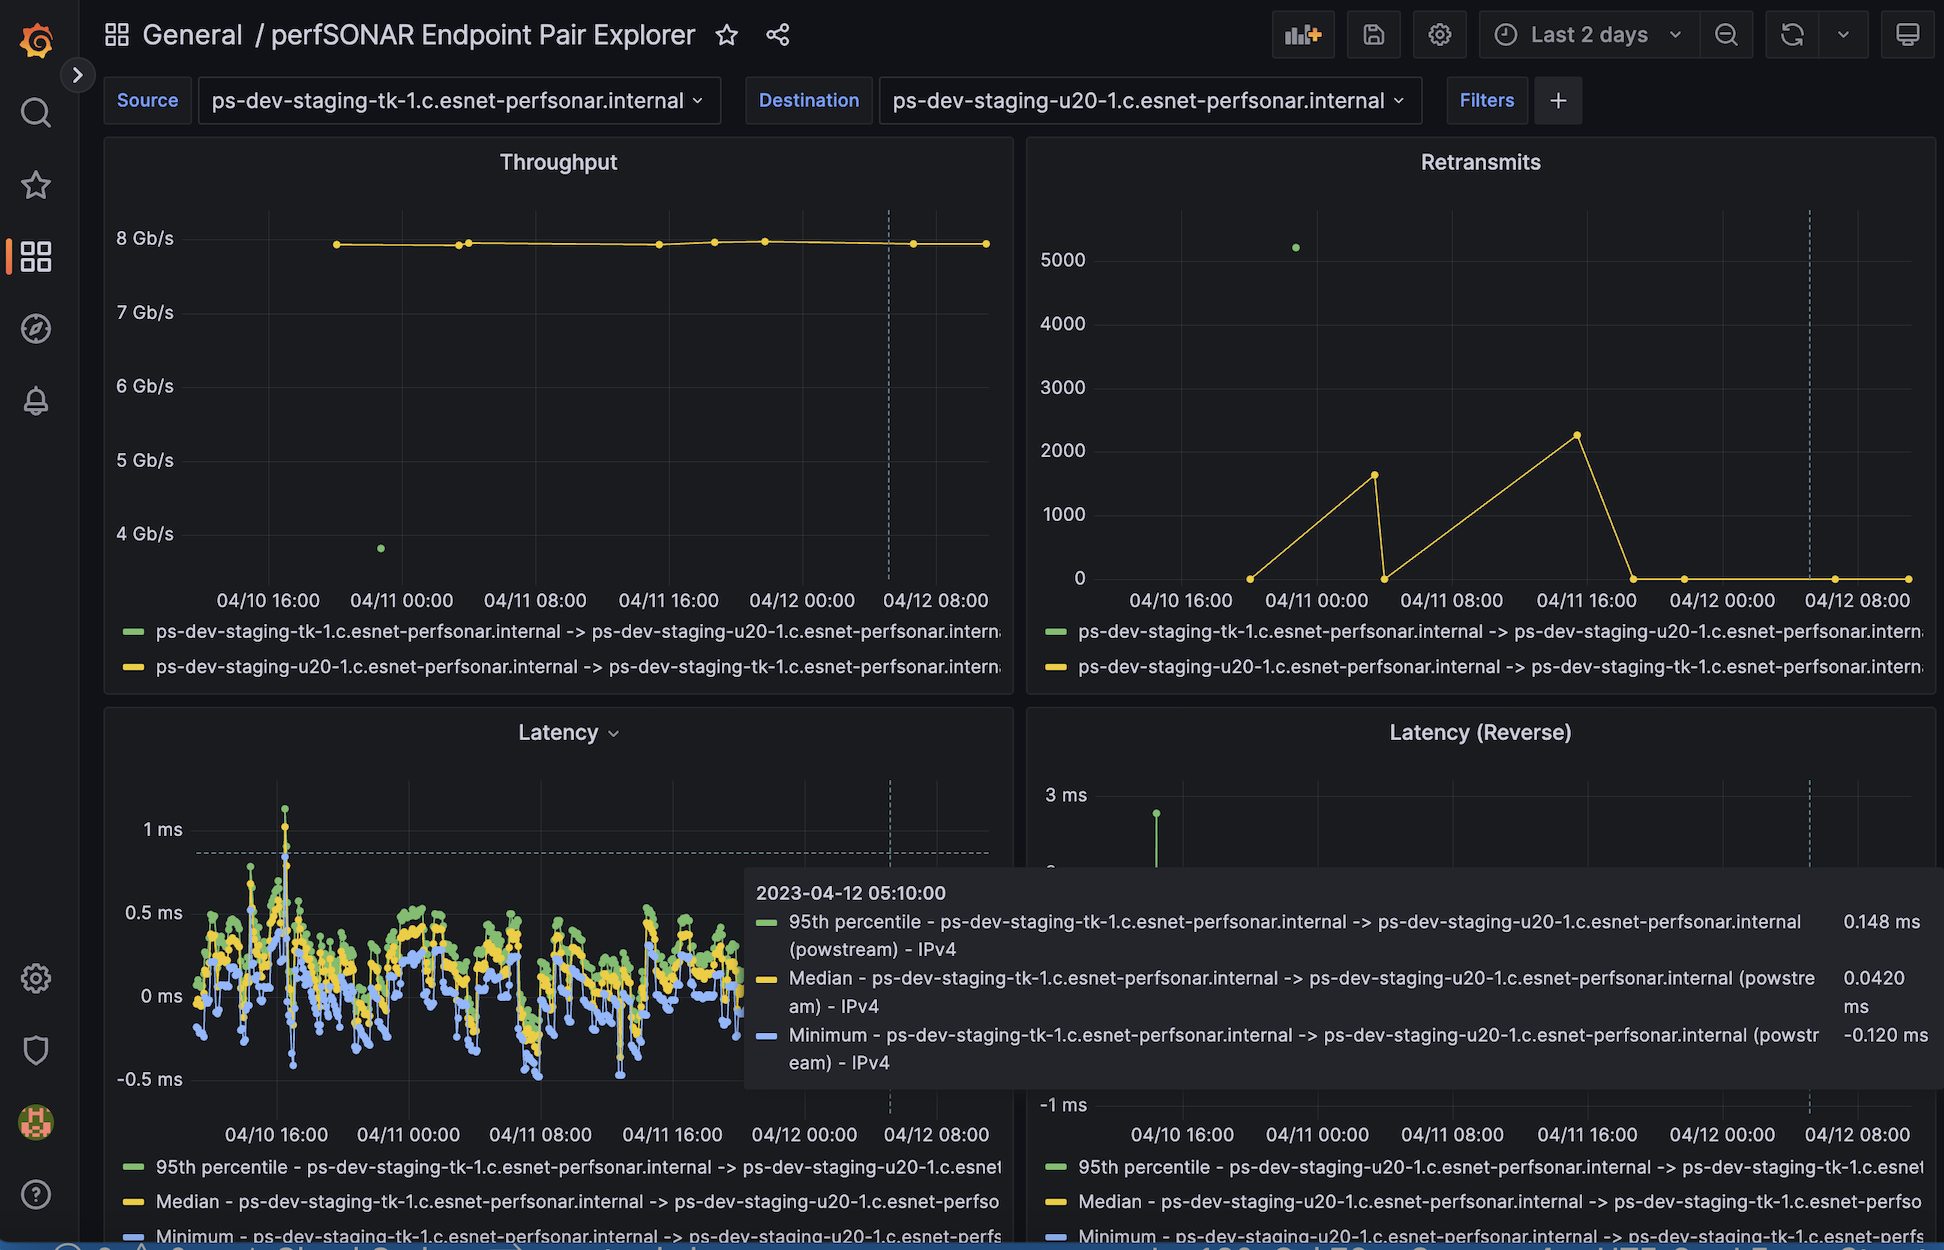
You will now have a page to look at specific endpoint pairs as shown below:
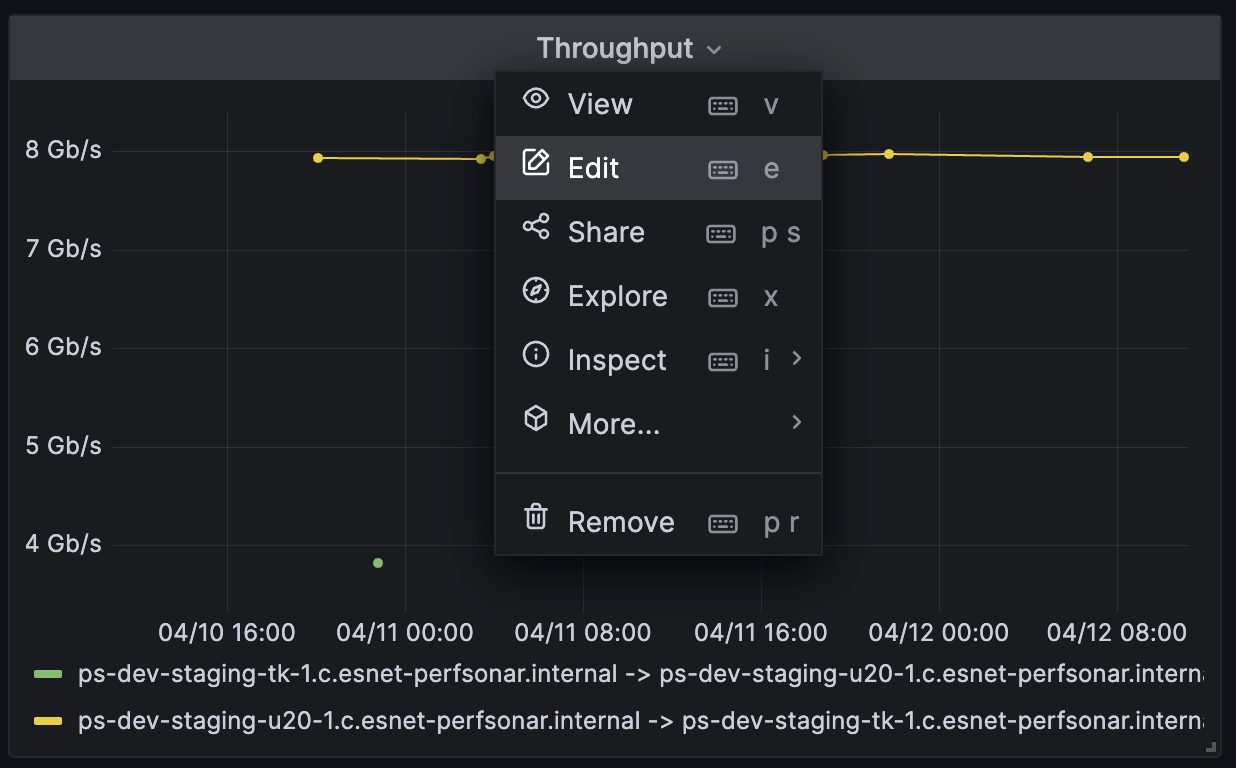
Now that you have a few dashboards imported, take a chance to explore. Try to not only understand the data being shown, but also explore the queries behind them and see if you can understand how they work. You can look at how the visualizations were configured by hovering over a panel, selecting its drop down menu at the top and selecting “Edit”. An example of this menu is shown below:
After you have spent some time exploring, proceed to the next section to walkthrough an example of how to build a basic line graph from scratch.
Step 5: Building Your Own Line Graph
This section will walkthrough how to build a new dashboard and add a line graph that shows maximum packet loss over time for all tests. This is intended to be a very simple example. The steps you follow to add this graph are similar to adding other visualizations, so can be used as a launching point to further customization. The steps for adding a new dashboard with a line graph are as follows:
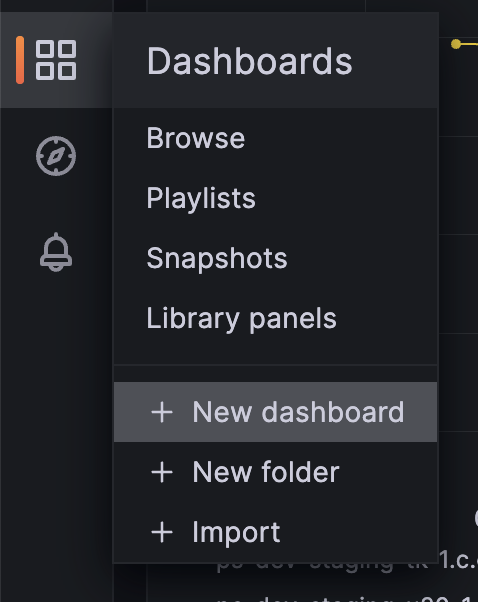
In the Grafana Menu on the left (not the top), hover over the “four square” icon and select “+ New dashboard”.
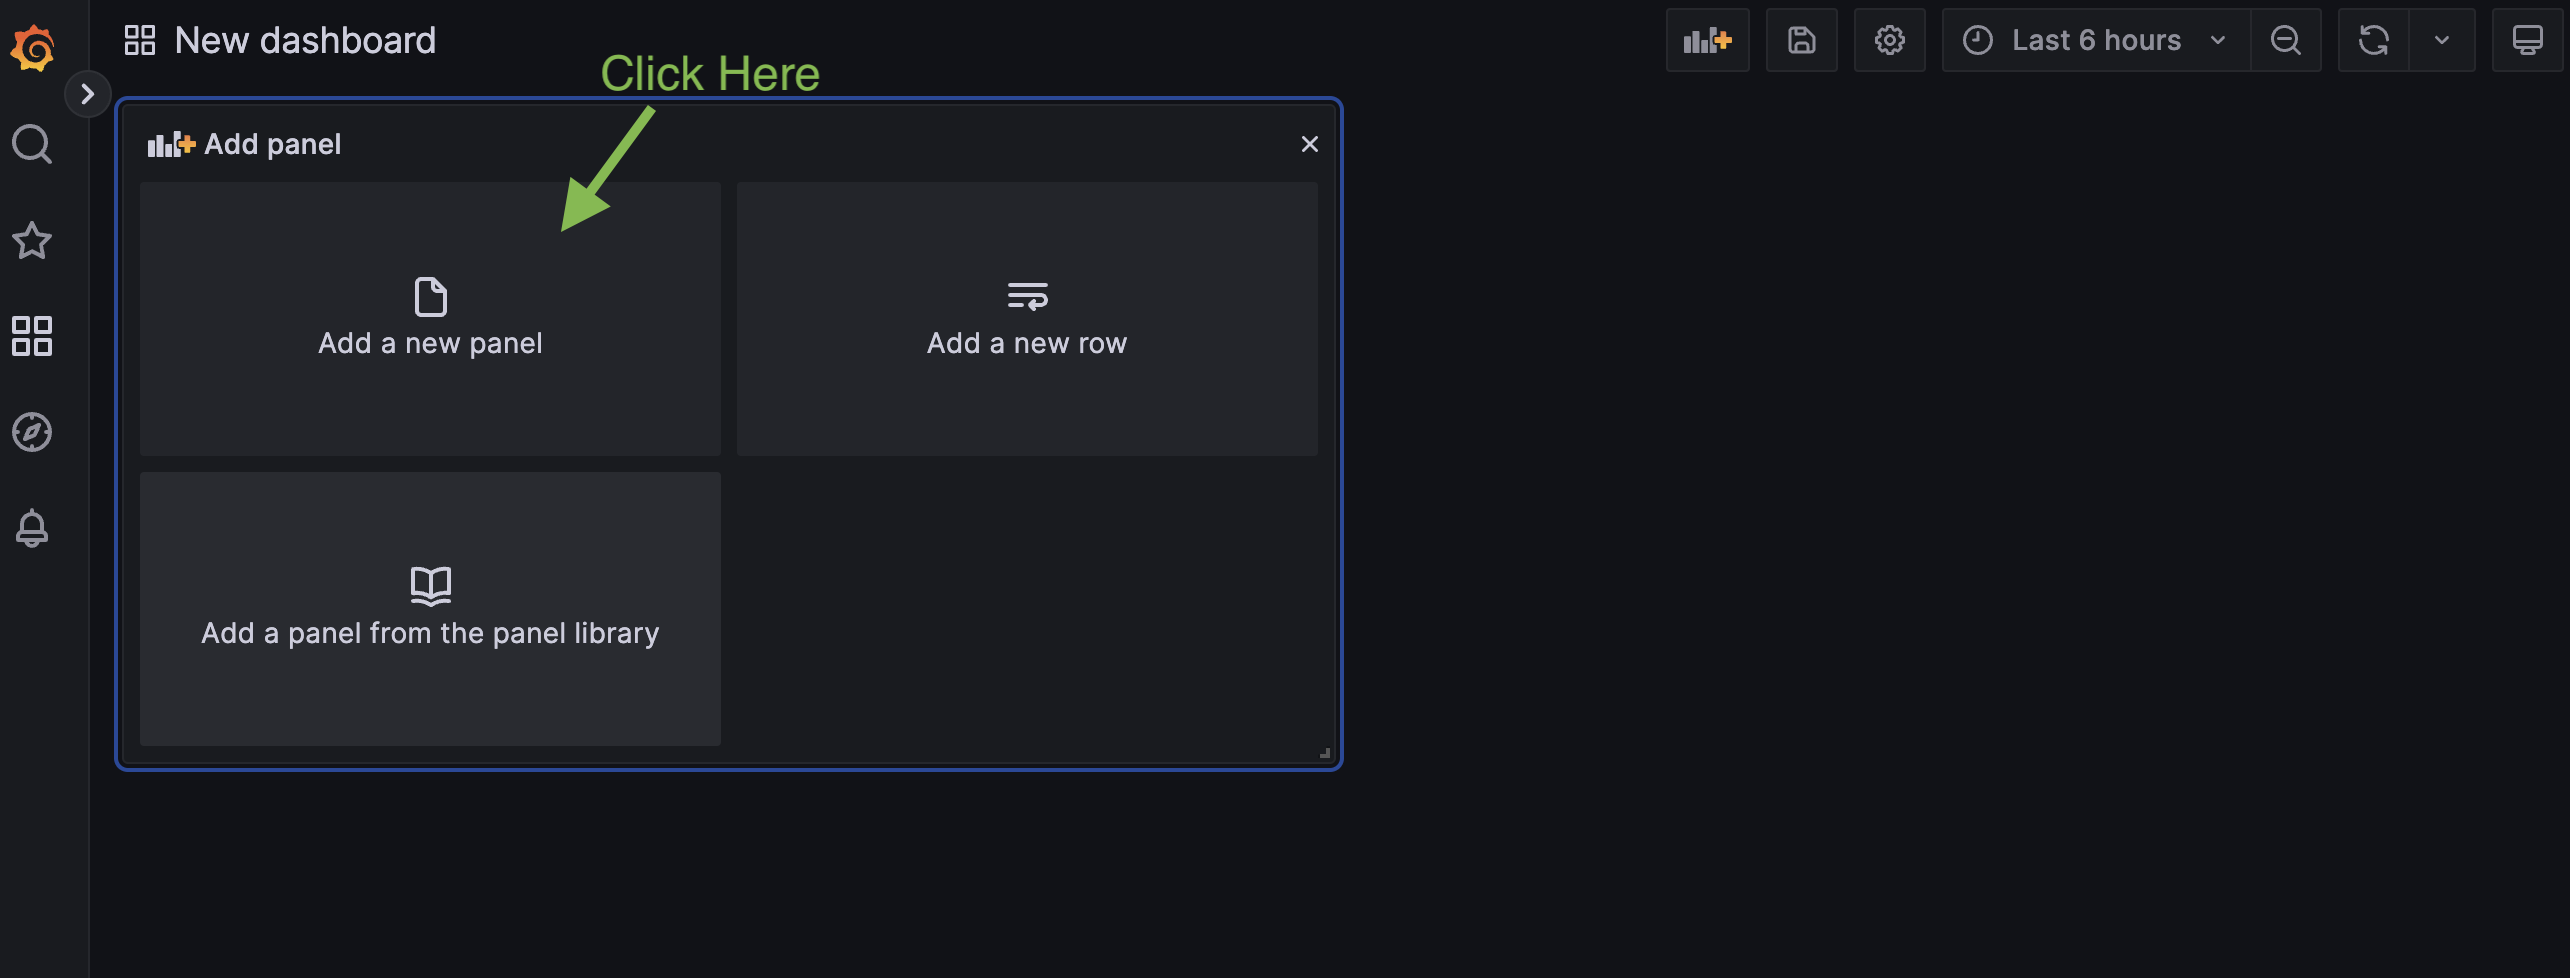
You should have a page that looks like below. Click “Add a new panel”
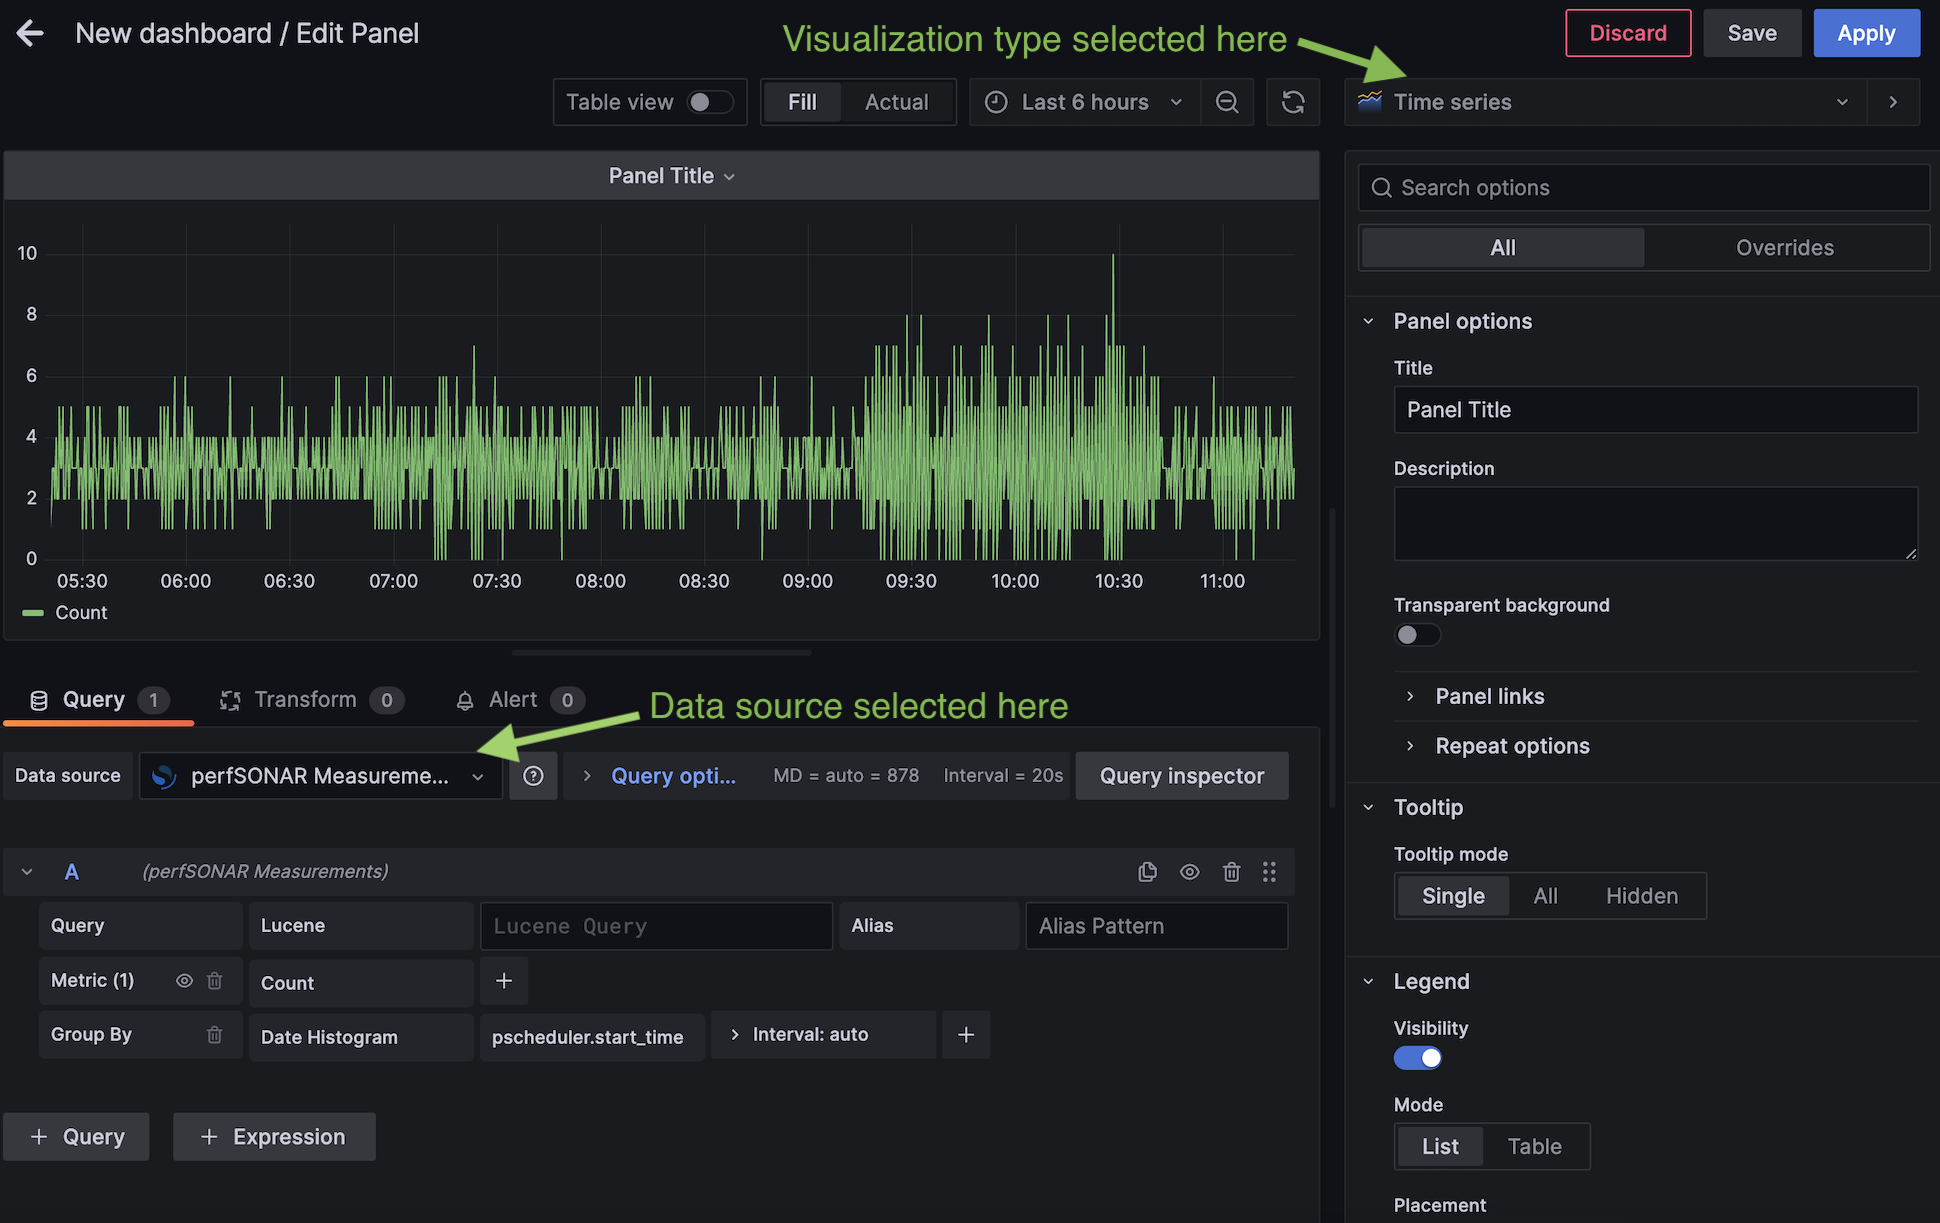
This loads an editor where you can build the query and control various settings of the graph. Let’s try to build a graph of the maximum packet loss over time. First, make sure the “perfSONAR Measurements” data source is selected as well as the “Time series” visualization.
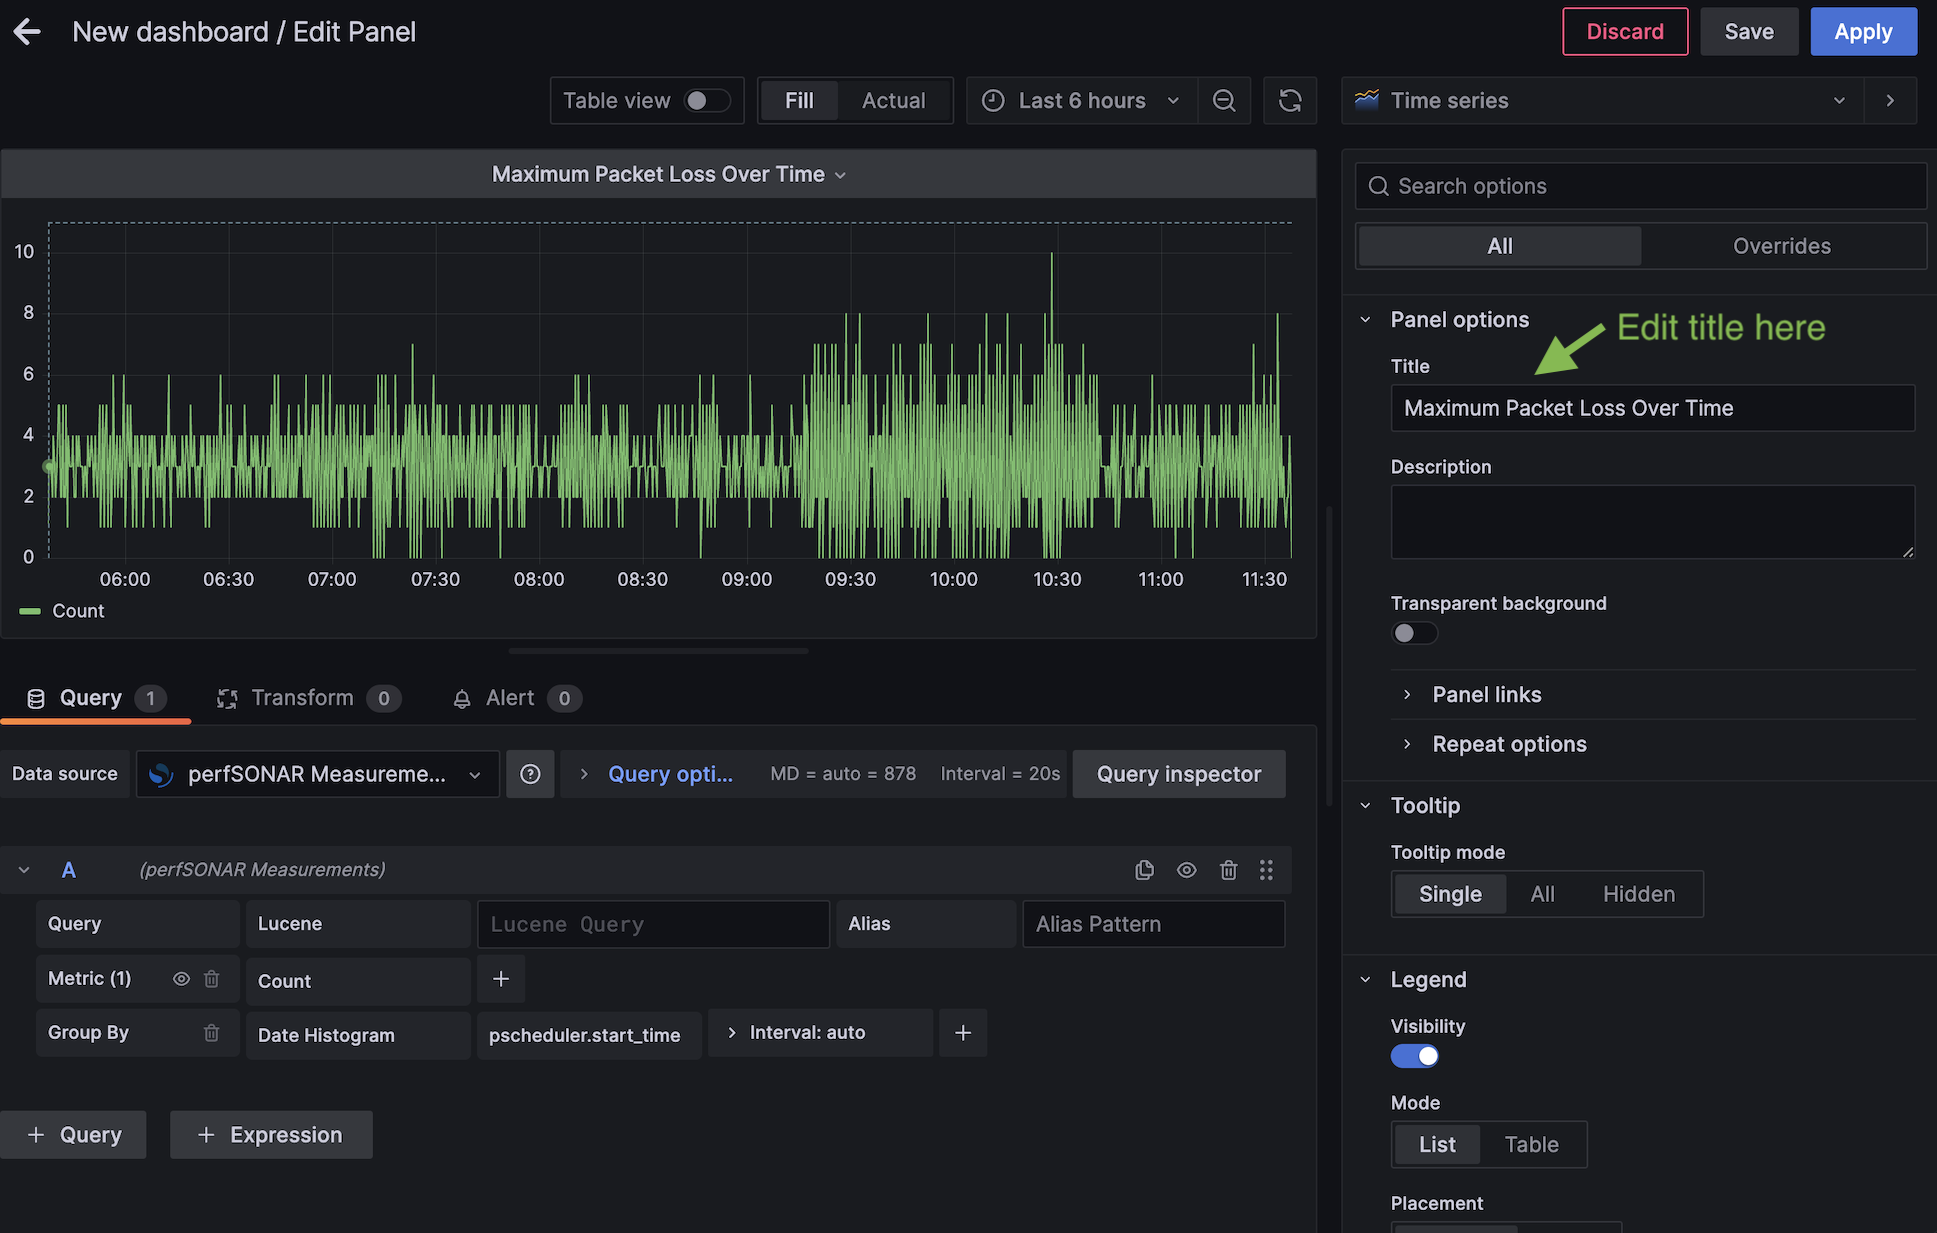
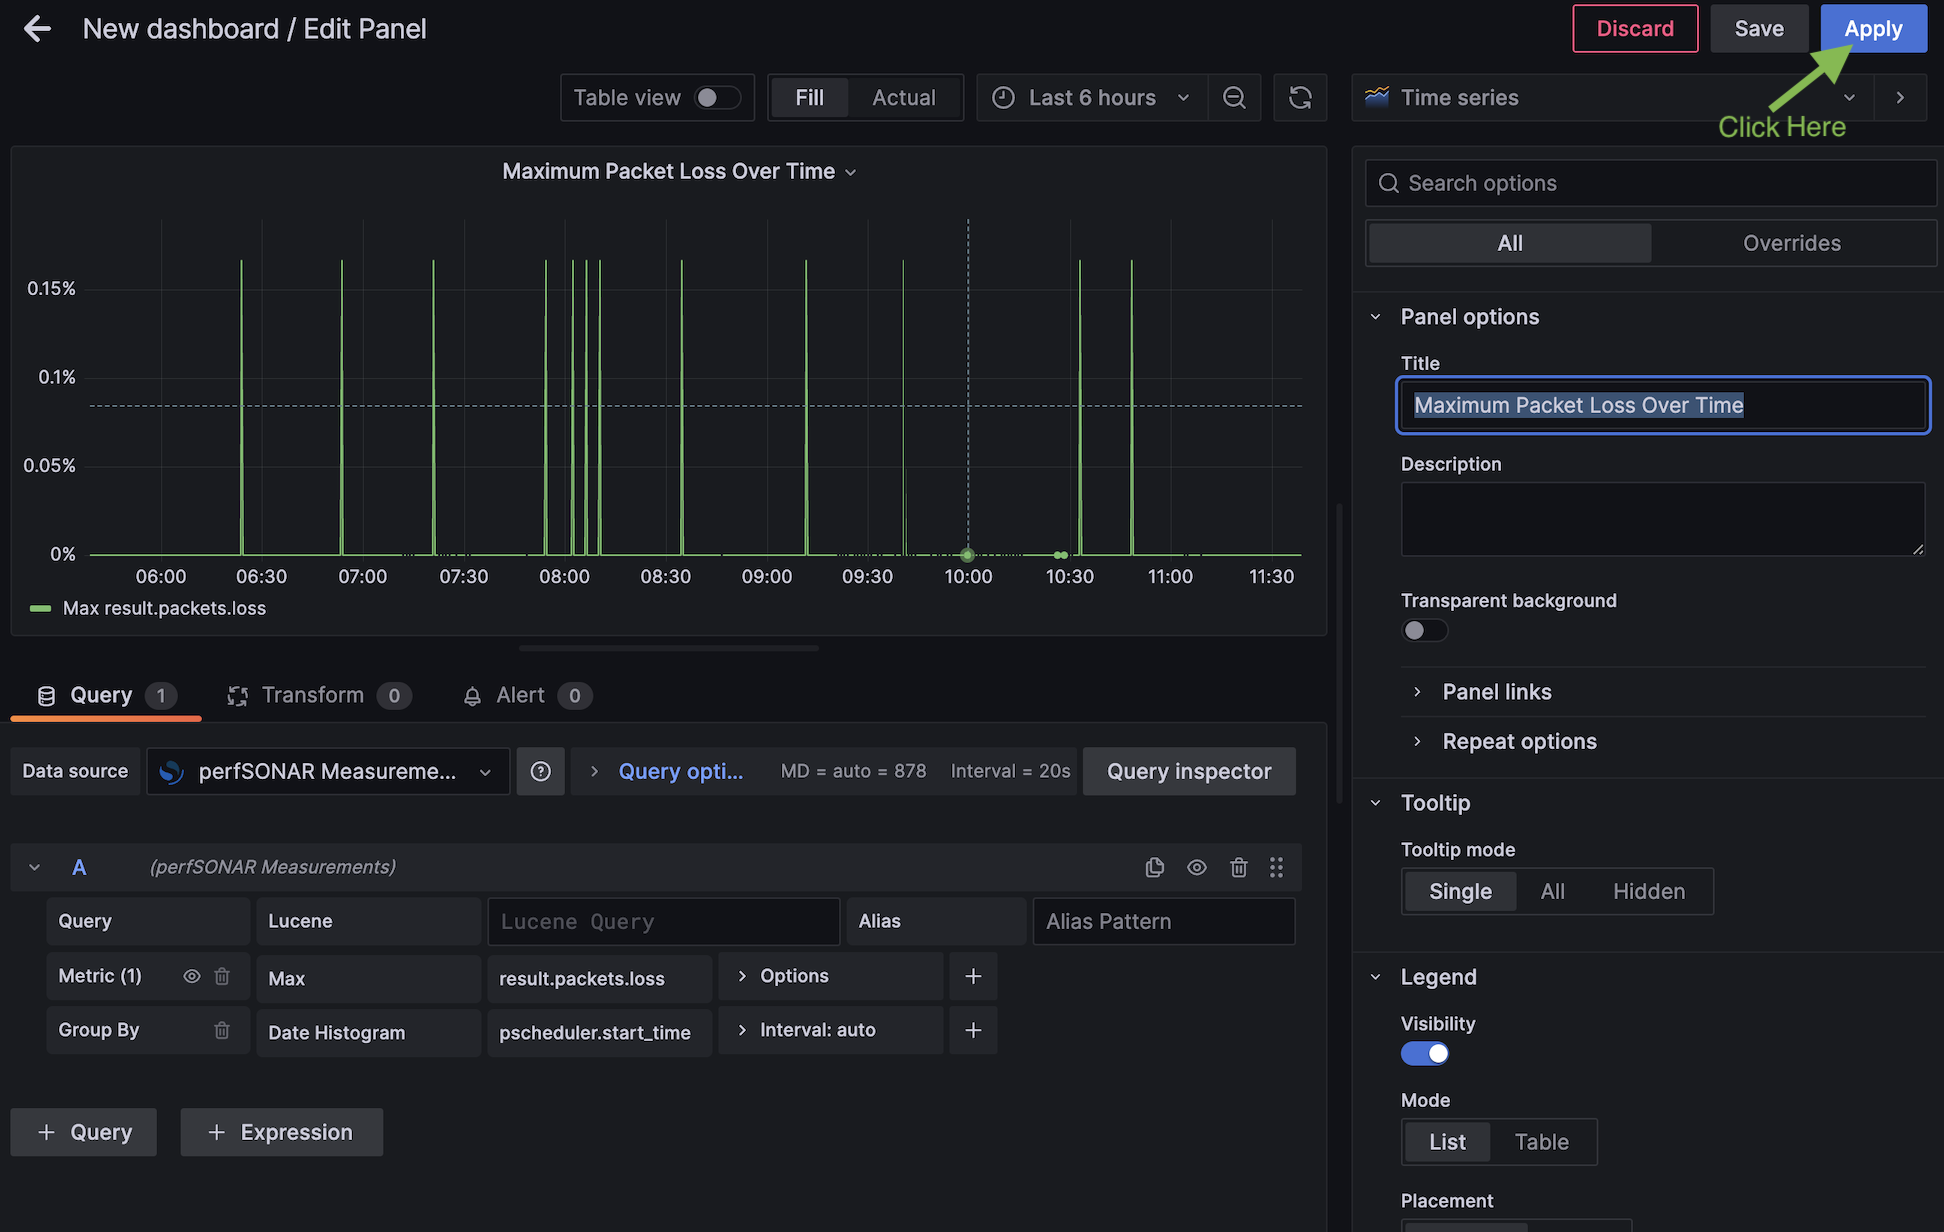
Change the title of the graph to “Maximum Packet Loss Over Time”:
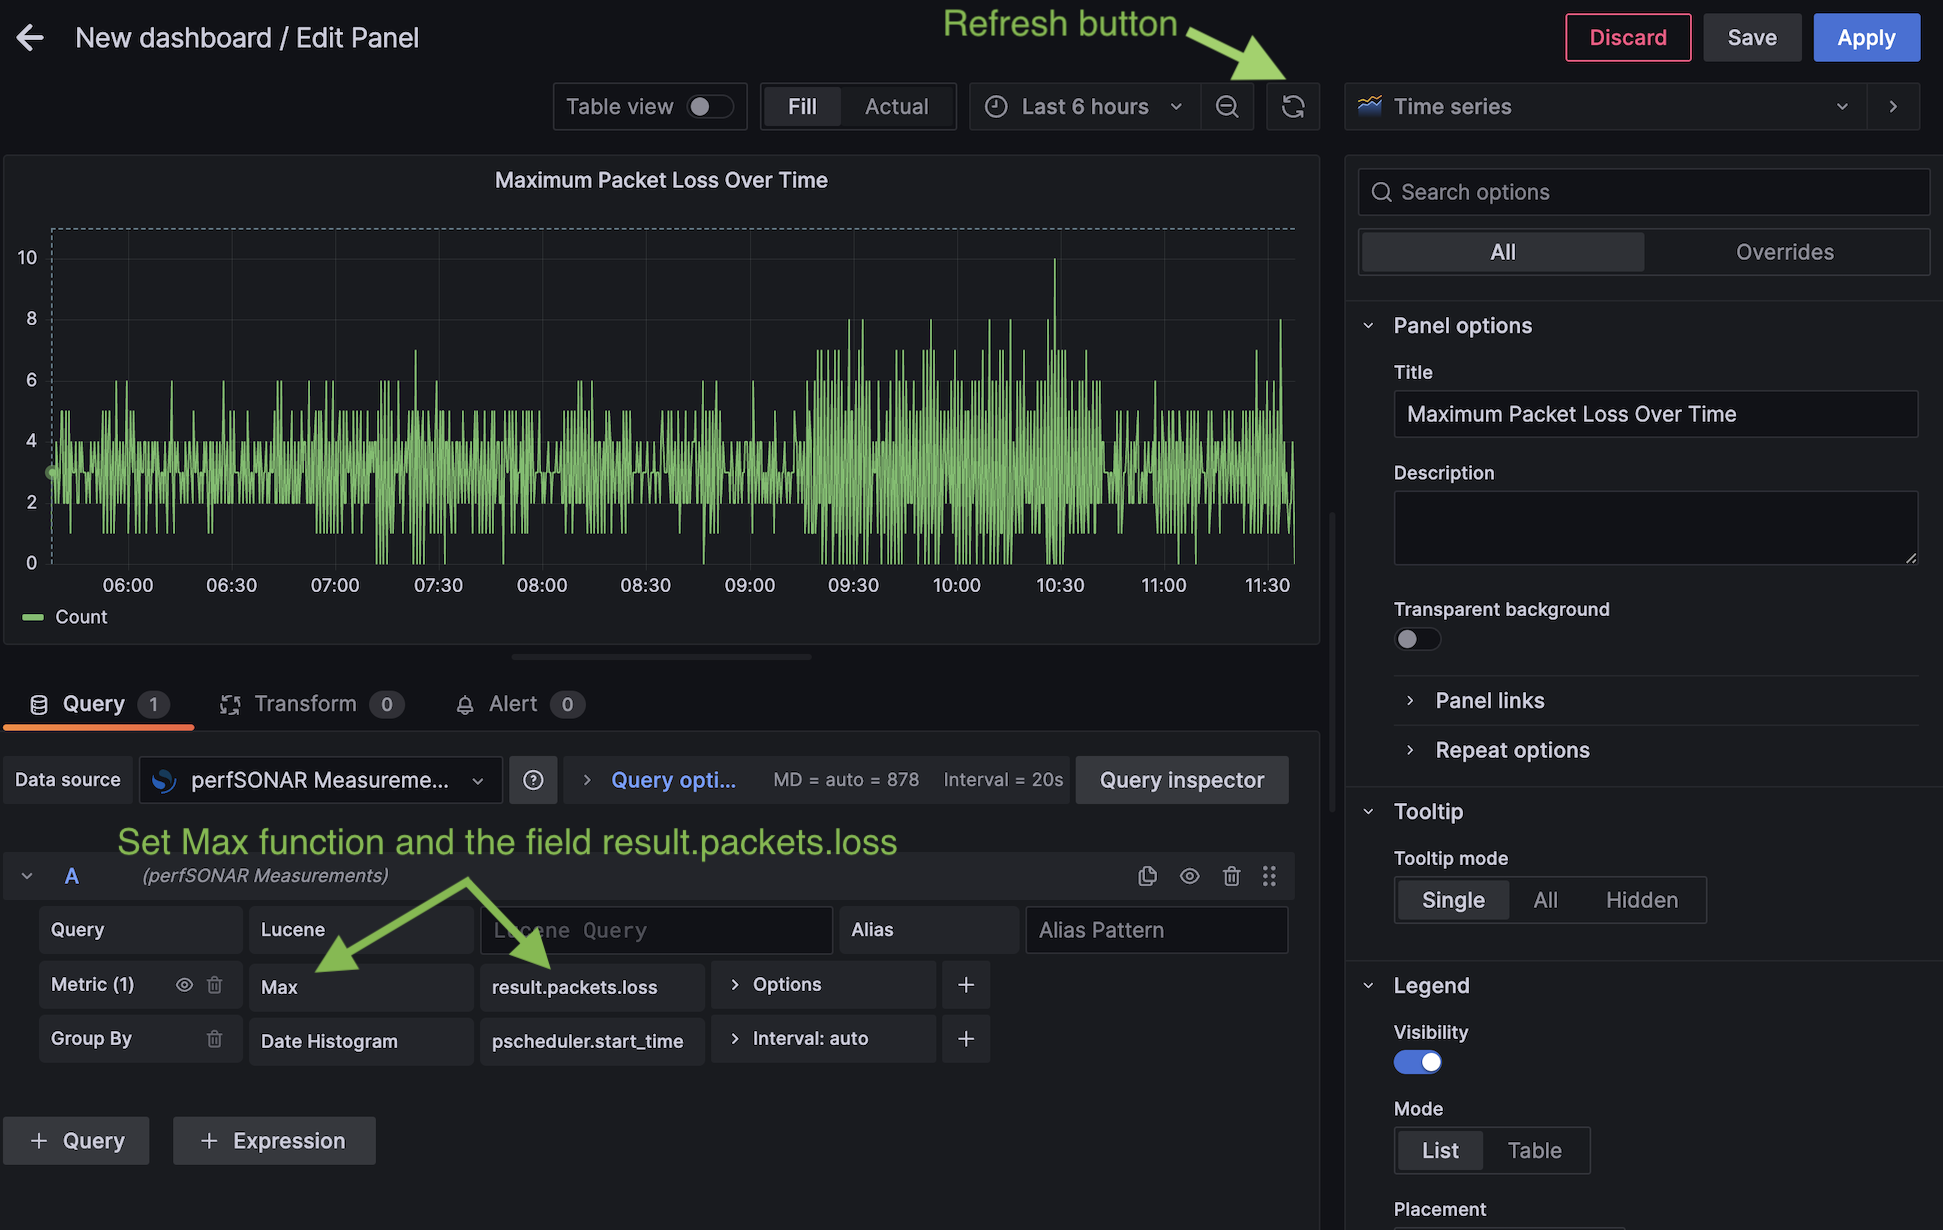
In the query Editor we are now going to change its default to do a “Max” calculation on the “results.packets.loss” field. (Note: After changing these fields, if the graph does not change, click the “refresh” icon on the page.) This is all shown below:
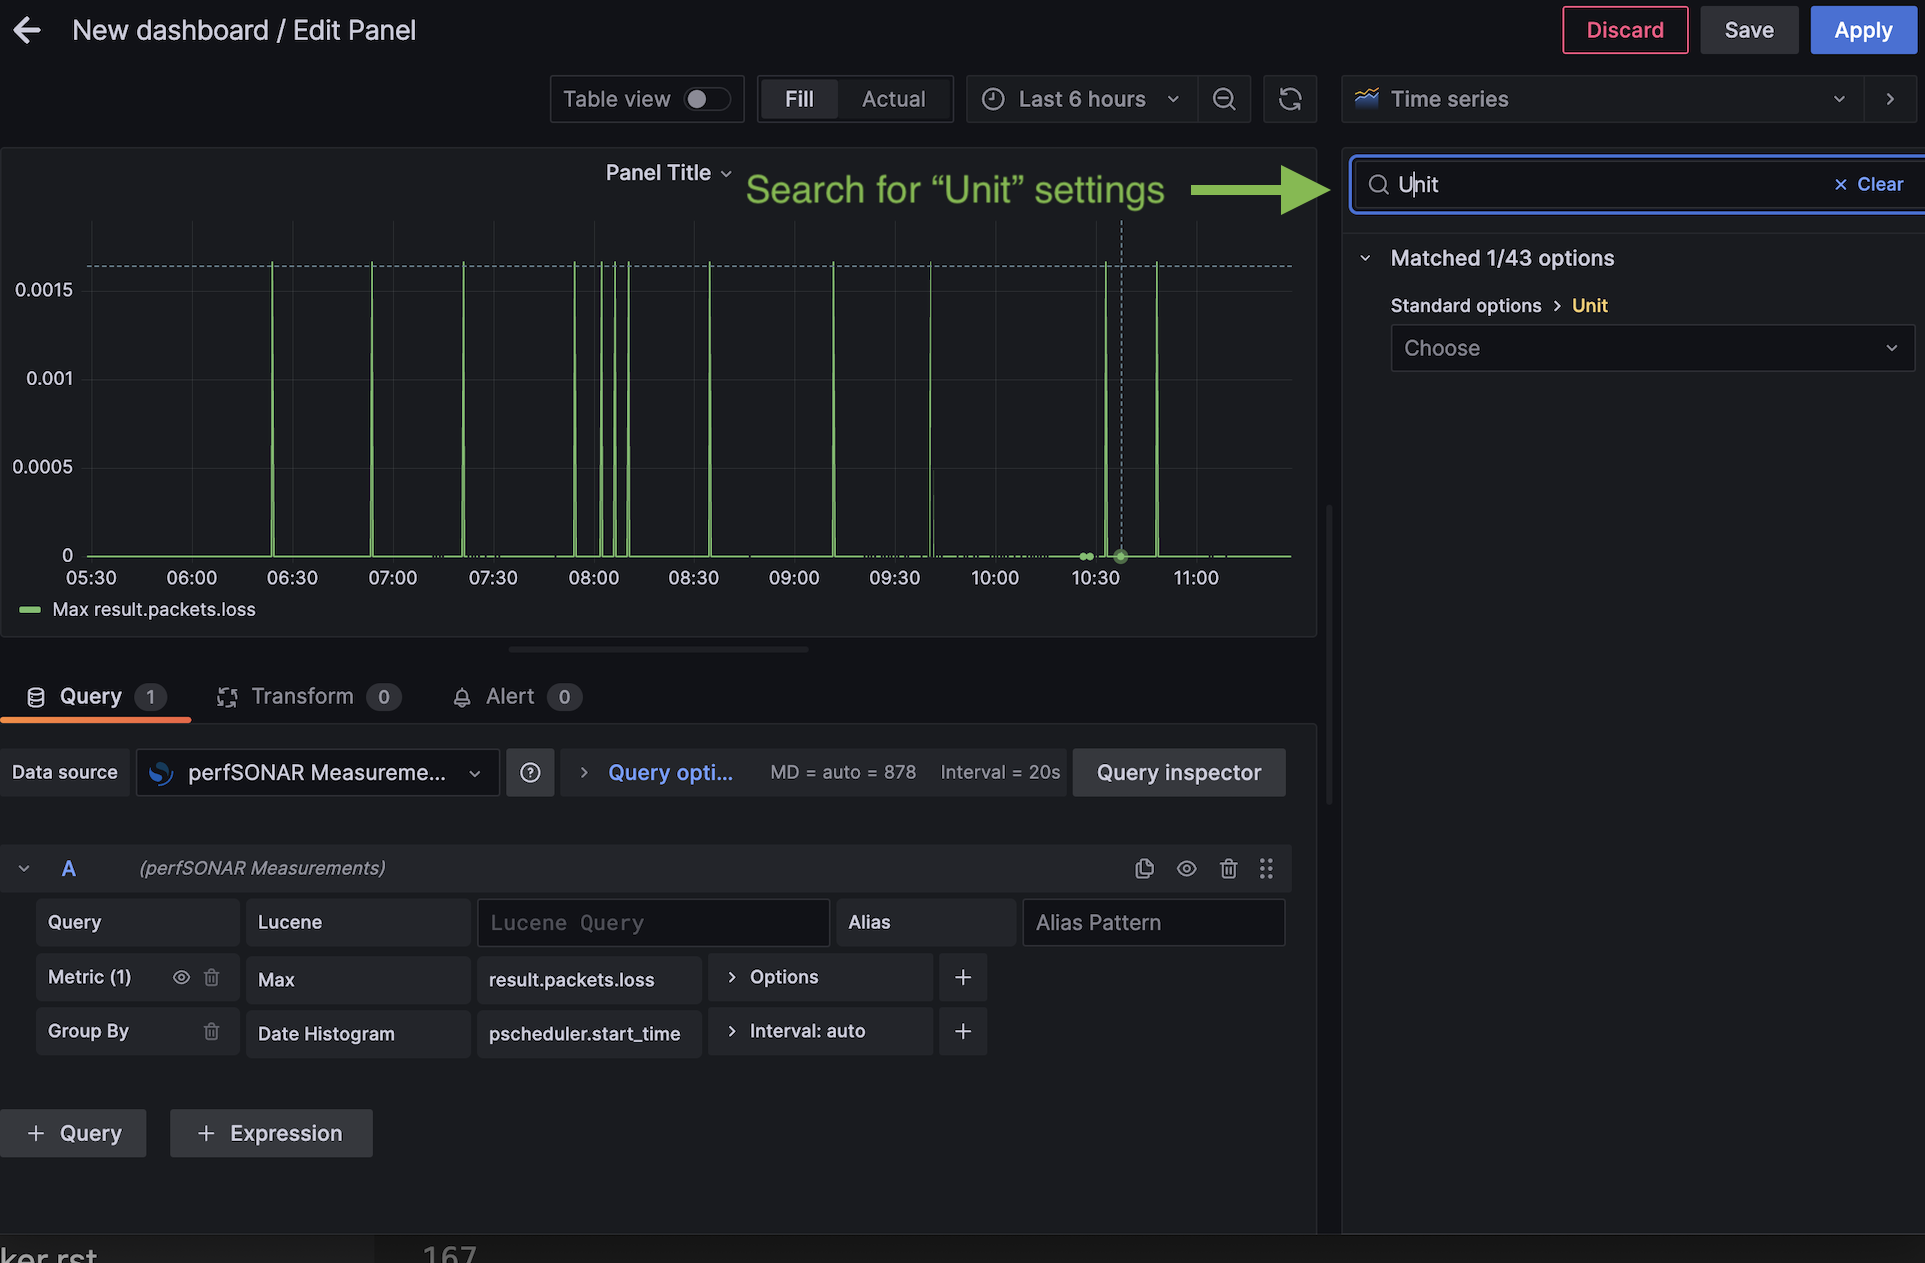
You should now see a graph of the packet loss. You will notice there are no units on the data in the Y axis. The “results.packets.loss” field is a numeric value from 0-1.0 representing a percentage. It would be ideal if this display as an actual percent as opposed to a decimal. Luckily, Grafana allows us to control the units. On the right panel, type “Unit” in the search box:
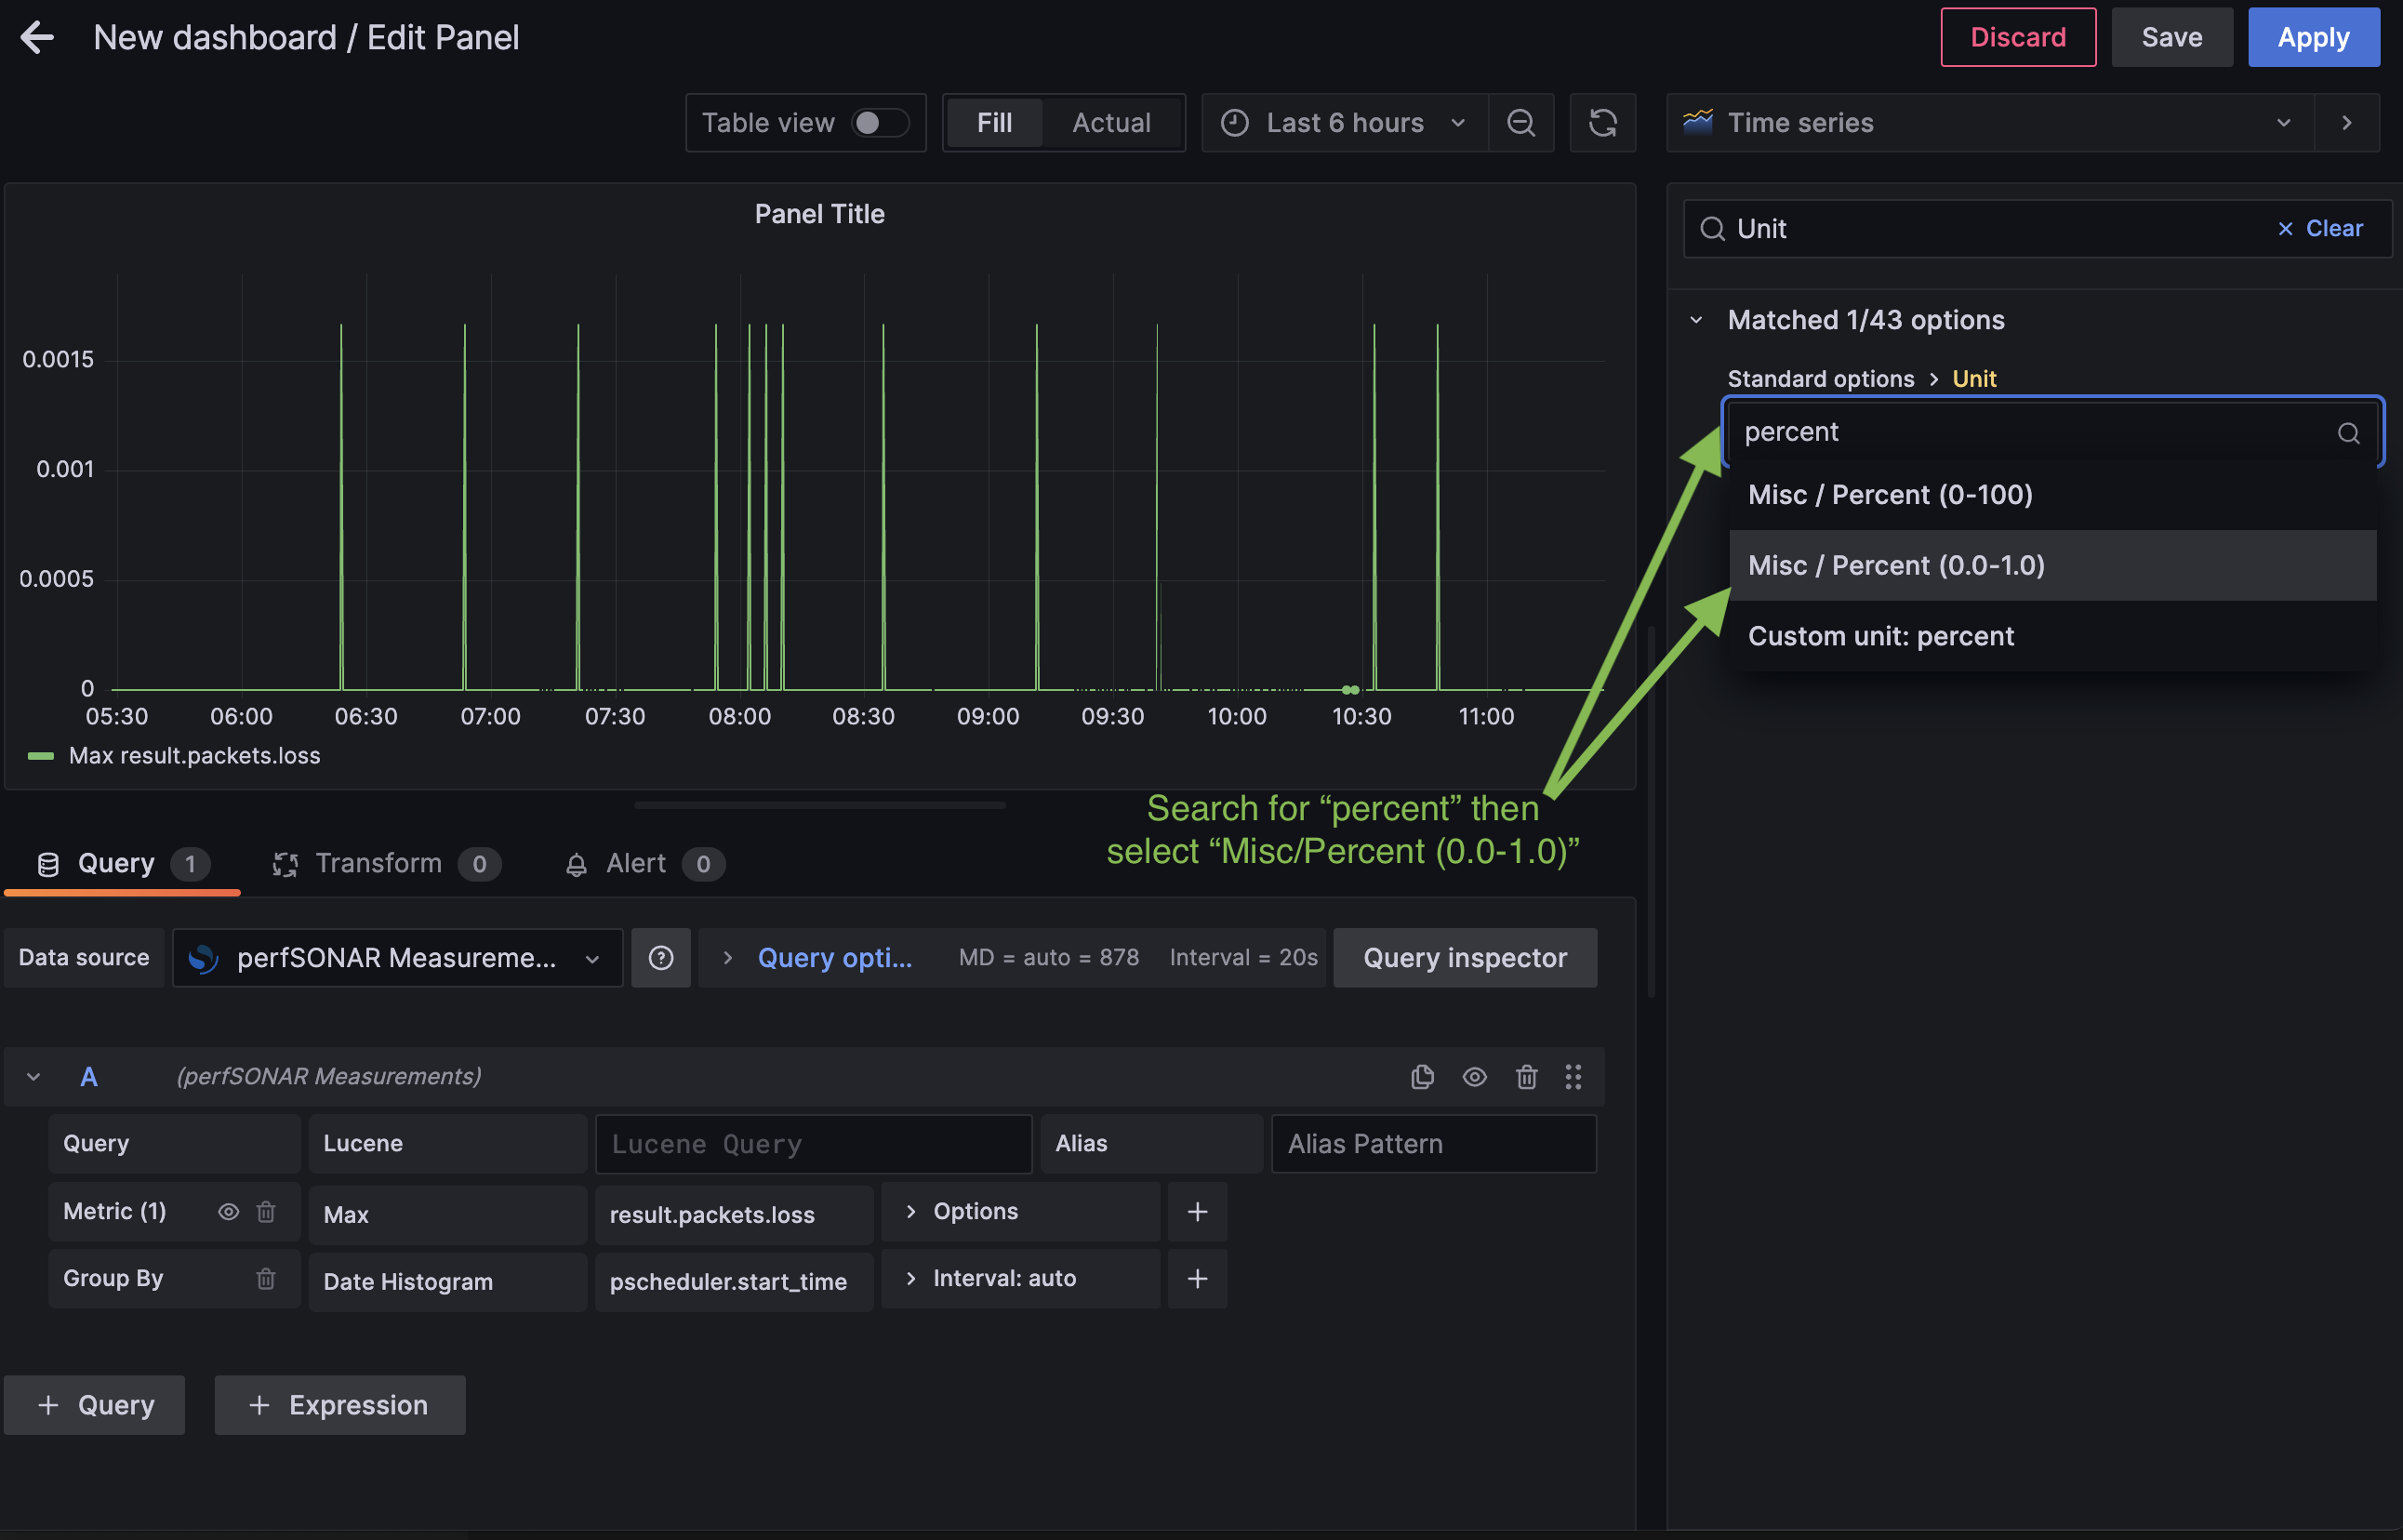
In the Unit search box, type “percent” and select “Misc/Percent (0.0-1.0)”
You now have a graph that shows the maximum packet loss values across all tests with proper units. Click “Apply” to leave the editor.
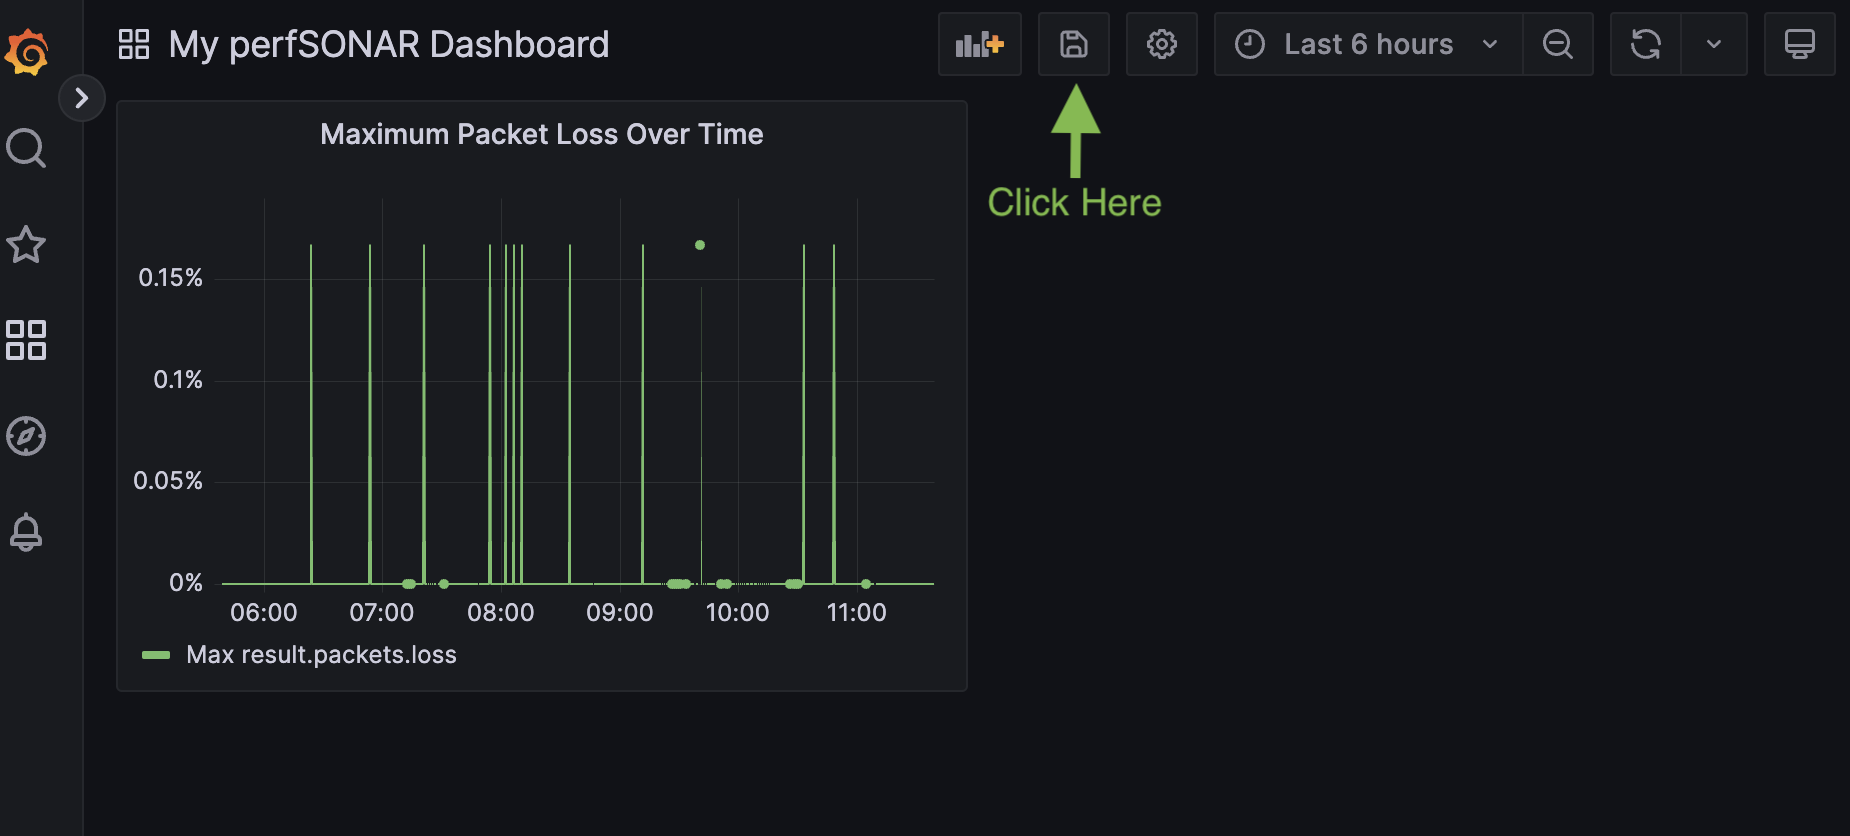
Now let’s save our work. Click the “Save” button (shaped like a floppy disk) on the upper right.
Name your dashboard and click Save. Below we call it “My perfSONAR Dashboard”
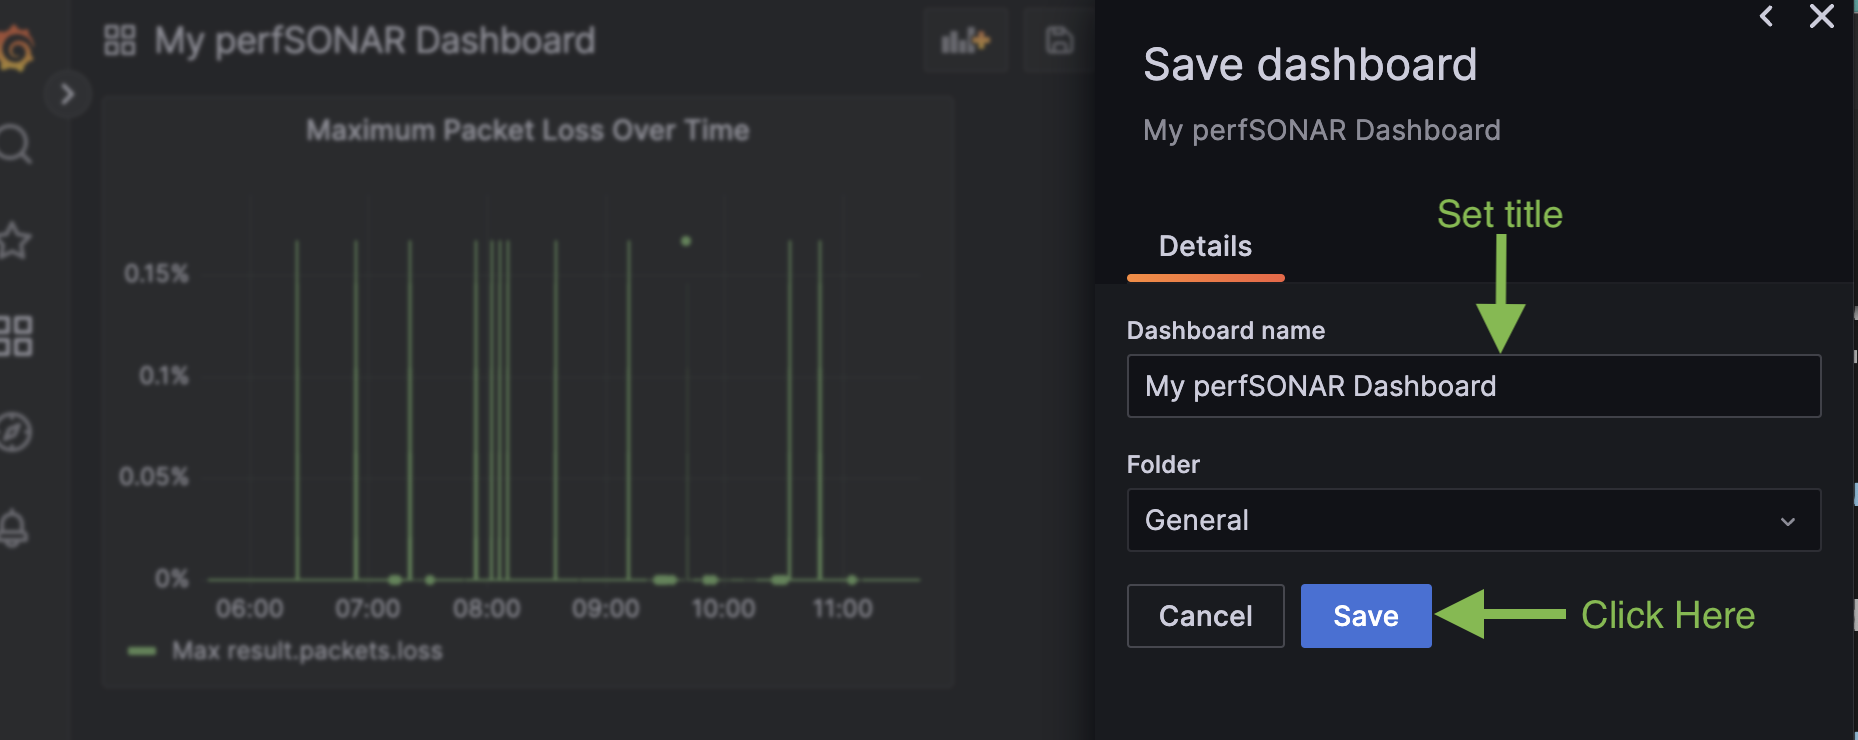
You now have a new dashboard! This is a very simple example but gives small a taste of the types of things you can build.
Next Steps
This document gave a walkthrough of how to get an initial Grafana instance running that can display perfSONAR data. As a next step, try building your own dashboard. It often helps to start by identifying a question you want to answer and then exploring the various options available. It often takes some trial and error since there are lots of settings to control the look of what you are trying to display. Be sure to experiment, and when you get something you like, consider sharing your work with the perfSONAR community, as we can all learn from each other.