The tools and services running on your host keep log files of major activity. The perfSONAR Toolkit provides utilities for exposing these logs via the web interface as well as tools to analyze their results. This page decribes the log files available and the additional tools provided for analyzing them.
Most perfSONAR related services keep log files under the directory /var/log/perfsonar. Some external tools store them in other areas under /var/log/ or elsewhere. There are many log files on the system but some of the most important ones (organized by the service that populates them) can be found below:
| Service | Log File(s) | When to Use |
|---|---|---|
| BWCTL and OWAMP | /var/log/perfsonar/owamp_bwctl.log | Every BWCTL and OWAMP test (both on the client and server side) is logged in this file. It should be used when a BWCTL or OWAMP test is not completing. It contains information about denied or failed tests. It may also contain information when an owamp-server or bwctl-server process crashes unexpectedly. |
| Esmond Measurement Archive | /var/log/esmond/esmond.log /var/log/httpd/error_log /var/log/cassandra/cassandra.log /var/lib/pgsql/pgstartup.log | If your measurement archive is not running or your graphs are not returning data you may want to look in one of these logs. esmond.log has information from the archive itself (e.g. improperly formatted requests). The HTTPD error log has information such as if esmond was able to connect to it’s underlying databases. Speaking of databases, esmond connects to both Cassandra and PostgreSQL so it may be worth checking those logs as well. |
| Network Diagnostic Tool (NDT) | /var/log/ndt/web100srv.log /var/log/ndt/fakewww_error.log /var/log/ndt/fakewww_access.log | Use these logs when you encounter problems running NDT either from the command-line or Java applet |
| perfSONAR Configuration Daemon | /var/log/perfsonar/configdaemon.log | If you are unable to save changes to the configuration made through the web interface, this is a good place to look. |
| perfSONAR Lookup Service Cache Daemon | /var/log/perfsonar/lscachedaemon.log | If you get a message saying that your communities or lookup service cache are out of date, this log file may contain more information. |
| perfSONAR Lookup Service Registration Daemon | /var/log/perfsonar/lsregistrationdaemon.log | Look here if your toolkit web page says that your host is not registered with the lookup service or you cannot find your host in the global services directory. |
| perfSONAR Regular Testing Scheduler | /var/log/perfsonar/regulartesting.log | If you are not seeing test results in the graphs or you are concerned some tests are not running, this log may have more information. |
| perfSONAR Service Watcher | /var/log/perfsonar/servicewatcher.log /var/log/perfsonar/servicewatcher_error.log | This log contains information about nightly restarts. |
| perfSONAR Web Interface | /var/log/perfsonar/web_admin/web_admin.log /var/log/httpd/error_log | Use these logs when you encounter problems with the web interface |
Note
The table above is not an exhaustive list of every log file on the system. It’s intended to point at some important log files that are commonly used to debug issues with perfSONAR tools. Depending on the exact issue you may need to view other log files on the system to diagnose a problem.
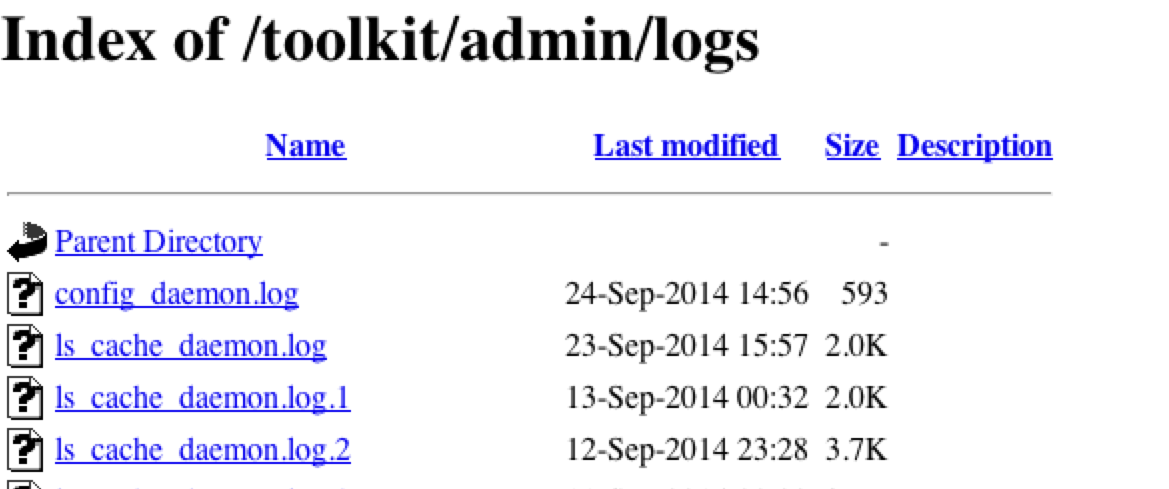
From your toolkit web interface, click perfSONAR Logs on the left menu
See also
See Managing Users for more details on creating a web administrator account
The log files should be listed on the page that loads
Copy the cron script to /etc/cron.hourly:
cp /usr/lib/perfsonar/scripts/logscraper.cron /etc/cron.hourly/logscraper.cron
Wait at least an hour for the script to run
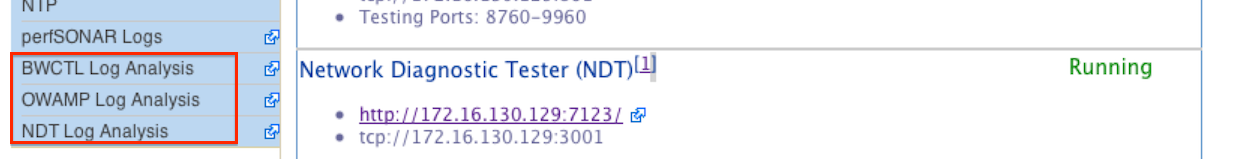
Visit the old tookit web interface at http://hostaddress/toolkit-old
Click BWCTL Log Analysis, OWAMP Log Analysis, or NDT Log Analysis (depending on the log you want analyzed) on the left menu
See also
See Managing Users for more details on creating a web administrator account
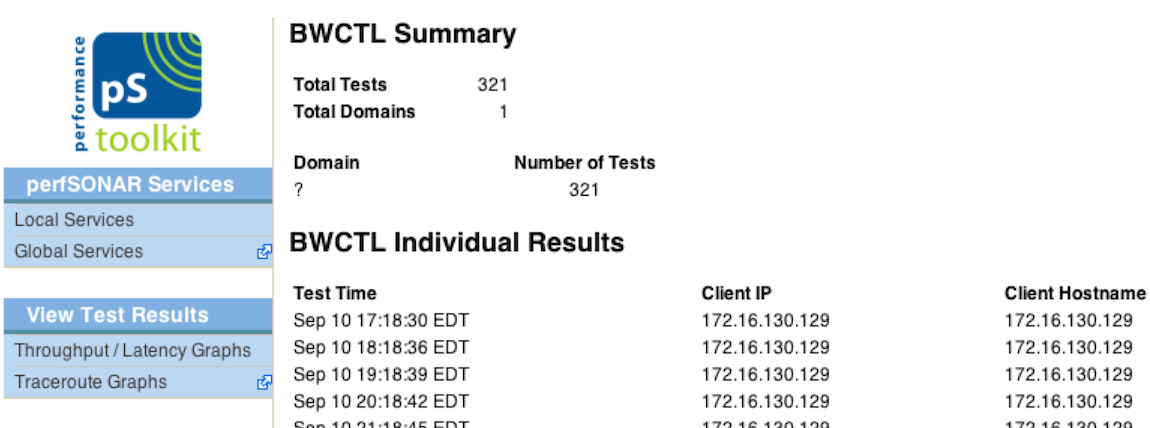
On the page that loads, you should see a listing of IP addresses and the times that they ran tests to your host
Warning
The cron script may consume significant system resources. Prior to version 3.5 the script was installed by default, but was removed due to this constraint. If you reinstall the file as detailed above, please use caution and note that it may affect your regular tests.