
Running the pSConfig MaDDash Agent
Introduction
pSConfig MaDDash Agent’s Role
The role of the pSConfig MaDDash Agent is to read pSConfig templates and generate a set of grids to be displayed by MaDDash. It does this by updating the primary MaDDash configuration file, maddash.yaml. The diagram below describes this role:
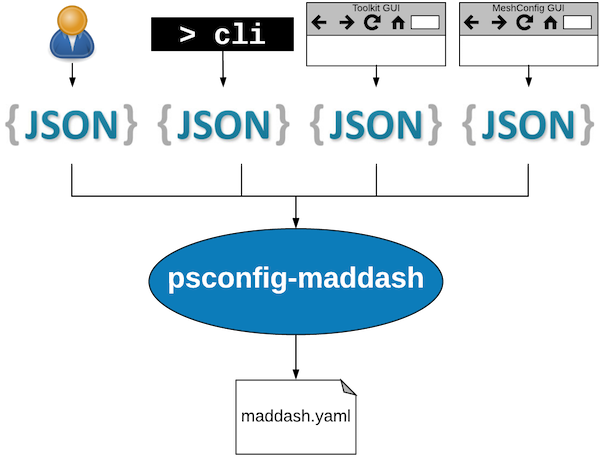
A diagram showing the psconfig-maddash-agent reading templates from a number of sources and generating a MaDDash configuration file.
Performing this role is a multi-step process that includes the following:
- Read the configured templates and optionally apply local modifications
- Determine how to display tasks
- Generate a
maddash.yamlfile
These steps are completed anytime one of the following events occur:
- The agent starts
- Within a configurable amount of time of a change to a local configuration file (changes to remote templates are not detected). By default the value is 1 minute.
- If no changes, on a configurable interval after the start of the last run. By default these steps are run every 1 hour.
Note
See Advanced Configuration for more detail on the configuration options mentioned above.
The remainder of this section describes each of these steps in greater detail.
Reading and Modifying Templates
The agents first job is to read a set of templates. The templates to read are configured by the administrator of the agent. For information on how to configure templates see Configuring Templates.
After reading a template, an agent is also capable of performing local modifications. See Modifying Templates for more details.
Determining How to Display Tasks
After reading the templates, the agent needs to decide how to display the task topology in MaDDash. This decision includes:
- Selecting which tasks to display
- Selecting how to analyze results
- Selecting how to visualize results
- Setting custom thresholds and other parameters
In Configuring Grids the process of defining how to display the tasks is detailed.
Generating the maddash.yaml file
After determining what to display, the agent outputs the result to /etc/maddash/maddash-server/maddash.yaml by default. At that point, MaDDash takes over and will detect the change within 60 seconds by default. Shortly thereafter visiting the MaDDash web interface should show the changes.
Note
The agent runs as the maddash user since this account owns the maddash.yaml file. This is contrast to many other perfsonar services that run as the perfsonar user or a user named for the component. This also impacts the owner and location of log files as detailed in Reading the Logs.
Installation
Installing the Standalone Package
The pSConfig MaDDash agent is installed with the package perfsonar-psconfig-maddash. You can run the following commands to install it:
CentOS:
yum install perfsonar-psconfig-maddashDebian/Ubuntu:
apt-get install perfsonar-psconfig-maddash
Installing as Part of a Bundle
The perfsonar-psconfig-maddash is included in the following perfSONAR bundles:
- perfsonar-centralmanagement
Running psconfig-maddash-agent
Starting psconfig-maddash-agent
systemctl start psconfig-maddash-agent
Stopping psconfig-maddash-agent
systemctl stop psconfig-maddash-agent
Restarting psconfig-maddash-agent
systemctl restart psconfig-maddash-agent
Checking the status of psconfig-maddash-agent
systemctl status psconfig-maddash-agent
Configuring Templates
Configuration Basics
In order for the agent to configure MaDDash, it must first be configured to read one or more templates. There are multiple ways to add a template depending on its location relative to the host system of the agent. These include:
- Configuring remote templates by supplying a URL and desired options to the agent. This is most commonly done using the
psconfig remotecommand. See Remote Templates for details. - Configuring local templates that live on the agent’s filesystem either using the
psconfig remotecommand or by copying the template files to a dedicated directory whose contents are automatically read by the agent. See Local Templates for details.
Remote Templates
The primary way to add, list, and delete the remote templates read by the agent is with the psconfig remote command.
Note
The psconfig remote command simply edits the /etc/perfsonar/psconfig/maddash-agent.json file. For most users it is recommended to use the psconfig remote command as opposed to editing the file directly as it is less prone to syntax errors.
As an example let’s say we have a pSConfig template at the URL https://10.0.0.1/example.json. The agent can be configured to read the template by running the following command as a root user:
psconfig remote add "https://10.0.0.1/example.json"
The above command will add the new template to the agent. The agent should begin reading the template within 60 seconds of the change if using default settings (i.e. no agent restart required).
You may also provide the command with additional processing instructions. To see the full set of options available run the following:
psconfig remote --help
Note
Unlike the pSConfig pScheduler Agent, the MaDDash agent will use archive definitions from templates with no extra options like --configure-archives. This is because MaDDash ultimately just uses the archives for reading data as opposed to writing results. Also, the agent would not be particularly useful otherwise since you cannot display results if you do not have them.
In addition to adding remote templates, you may also view them. The following command lists the remote templates in use by the agent:
psconfig remote list
The above command returns a list of JSON objects containing the template URL and any options set.
Finally, to remove our example remote template we can run the psconfig remote delete command as a root user as shown below:
psconfig remote delete "https://10.0.0.1/example.json"
The command accepts only a URL and will remove the agent’s pointer to that template. Within 60 seconds of executing that command, the agent will run and instruct MaDDash to cease display of any tasks from the removed template.
Note
The psconfig remote command is also the command used by the pScheduler agent to manage remote templates. If you have both agents installed on the same system, then any psconfig remote command will affect both agents by default. If you’d only like a command to apply to the MaDDash agent then add the --agent maddash option. Run psconfig remote --help for full details.
Local Templates
The agent can read templates from the local filesystem. One way to do this is by giving the psconfig remote command either a URL beginning with file:// or an absolute path to the file on the filesystem. An example command is below where /path/to/template.json is the example path to the template file:
psconfig remote add /path/to/template.json
Everything about the command works the same with a file path as it would with a http/https URL. See Remote Templates for more details on this command.
A second way you can add a local template is to copy it into the template include directory. By default this is located at /etc/perfsonar/psconfig/maddash.d/. For example:
cp /path/to/template.json /etc/perfsonar/psconfig/maddash.d/template.json
Any file ending with .json in this directory will get read by the agent automatically. Some important notes about including files in this manner:
- Adding a new file, removing a file or updating a file within the template include directory will get detected automatically by the agent within 60 seconds of the change (i.e. no need to restart the agent).
- Files are read every 60 minutes regardless of changes when the agent checks on the state of the grids it has created in MaDDash.
- The agent will follow symlinks if you use those instead of copying the file directly, though it may affect the agent’s ability to detect changes (i.e. you may have to wait up to 60 minutes for the agent to see the changes).
- The agent ignores any files that do not end in
.json
Modifying Templates
Template modification in the MaDDash agent works exactly the same as in the pScheduler agent. They both use the same commands and directories to perform these operations. See Modifying Templates in the pScheduler agent document for full details.
Configuring Grids
What is a grid?
After reading the templates, the agent needs to decide how to display the results produced by the task topology in MaDDash. Displaying the results requires specific instructions to be given to the agent with regards to which tasks to display and how to display them. By default the agent knows nothing about specific test types nor what to tell MaDDash to do with them. In order for it to translate a task to someting displayable it needs additional information.
First of all it needs to associate a task from the template with a check. A check is an action to perform that generates a result for MaDDash to display. It consists of a command to run and additional information such as a URL to a graph. Usually this command takes the form of a nagios command since that is what MaDDash knows how to run. Building these commands manually is cumbersome so the pSConfig MaDDash agent ships with a number of check plugins. These plugins define the types of tasks they understand, the types of archives they know how to read and ultimately use this information map the task parameters into a command-line template that can be stored in maddash.yaml. Note that the agent DOES NOT run this command, it simply builds the command template string for MaDDash to run.
The check also needs to be associated with a visualization. A visualization is a URL that points at more information about a task’s result. More specifically this is the graph displayed when a cell is clicked in the MaDDash web interface. This URL may also contain parameters needed to grab the results of the test. Similar to checks, the agent includes visualization plugins that build the URL based on the contents of a task.
Finally, these two concepts are brought together into a grid. A grid is the unit of configuration that instructs the agent how to convert pSConfig template tasks into something MaDDash can display. It consists of a check plugin, a visualization plugin and any desired customizations allowed by each. Potential customizations include task selection criteria, check thresholds and many other parameters. The name grid stems from the fact that it ultimately translates a pSConfig task object into the grid representation fundamental to MaDDash.
This is a fair amount of terminology but the MaDDash agent provides configuration utilities that hopefully allows you to ignore or explore as much detail as you want. The remainder of this section is about how to configure grids with these utilities.
Introduction to the psconfig maddash-grid command
Grids are configured using the psconfig maddash-grid command. By default, your agent comes pre-configured with some common grid definitions. You can view them with the following command:
psconfig maddash-grid list
This should lead to the following output:
{
   "default_ping_loss" : {
      "priority" : {
         "group" : "ping_loss",
         "level" : 1
      },
      "check" : {
         "type" : "ps-nagios-ping-loss"
      },
      "visualization" : {
         "type" : "ps-graphs"
      },
      "display-name" : "Ping Loss"
   },
   "default_trace" : {
      "priority" : {
         "group" : "trace",
         "level" : 1
      },
      "check" : {
         "type" : "ps-nagios-traceroute"
      },
      "visualization" : {
         "type" : "ps-traceroute-viewer"
      },
      "display-name" : "Path Count"
   },
   "default_loss" : {
      "priority" : {
         "group" : "loss",
         "level" : 1
      },
      "check" : {
         "type" : "ps-nagios-loss"
      },
      "visualization" : {
         "type" : "ps-graphs"
      },
      "display-name" : "Loss"
   },
   "default_throughput" : {
      "priority" : {
         "group" : "throughput",
         "level" : 1
      },
      "check" : {
         "type" : "ps-nagios-throughput"
      },
      "visualization" : {
         "type" : "ps-graphs"
      },
      "display-name" : "Throughput"
   }
}
Each of these grids do the following:
- default_ping_loss - Creates grids of all rtt tasks that alarm on the packet loss values using a default set of thresholds.
- default_trace - Creates grids of all trace tasks that alarm on the number of unique paths seen using a default set of thresholds.
- default_loss - Creates grids of all latency and latencybg tasks that alarm on the packet loss using a default set of thresholds.
- default_throughput - Creates grids of all throughput tasks that alarm on the throughput values reported using a default set of thresholds.
If these grids fit your needs, you may not need to do any further configuration. You can remove any of these grids with a the command psconfig maddash-grid delete --name NAME where NAME is the name of the grid to delete. An example set of commands that delete all of the default grids is shown below:
psconfig maddash-grid delete --name default_ping_loss
psconfig maddash-grid delete --name default_trace
psconfig maddash-grid delete --name default_loss
psconfig maddash-grid delete --name default_throughput
Note
If you leave these grids in place and then add your own grids using the same check plugin, make sure you set the priority otherwise you may end up with duplicate grids in MaDDash.
If you’d like to add your own grid(s) then you can use the psconfig maddash-grid add command. The command requires three parameters as shown in the example below:
psconfig maddash-grid add --name example_loss --check-type ps-nagios-loss --visualization-type ps-graphs
The meaning of each parameters is as follows:
- The –name is used to identify the check if later modifying it. Only letters, numbers, hyphens(-), colons(:) and periods (.) are allowed in the name (no whitespace or other specical characters). This value will be used in the name displayed if the
--display-nameoption is not provided. In the example the check will be referred to asexample_loss. - The –check-type indicates the check plugin to use. The
ps-nagios-lossplugin is selected in the example. That is a check that by default queries an esmond server for loss data from tasks with test type latency or latencybg. If you specify an invalid plugin the tool gives an error and lists the valid plugins. See Determining Check Plugins Installed for determining the list of plugins installed and how to get more info. - The –visualization-type indicates the visualization plugin to use. In the example
ps-graphsis used which is the standard perfSONAR graphs that can query esmond for throughput, latency, and loss information. If you specify an invalid plugin the tool gives an error and lists the valid plugins. See Determining Visualization Plugins Installed for determining the list of plugins installed and how to get more info.
The psconfig maddash-grid add will not only add new grids but modify existing ones as well. Simply refer to the existing grid by name and provide the remainder of the options just like you’re adding it for the first time. The existing grid will be completely replaced with your new definition.
The psconfig maddash-grid edit command will modify existing grids as well, but does not require every option to be specified at the command-line for it to be maintained. For example, if we want to set the priority (see Adding Multiple Grids with the Same Check Type) of the example_loss grid we added in the last example, then we can run the following:
psconfig maddash-grid edit --name example_loss --priority-group loss --priority-level 2
This covers the basics of the maddash-grid command, see the remaining sections for more information on working with grids.
Determining Check Plugins Installed
You can list all the check plugins installed on your host with the following command:
psconfig maddash-check-plugins
It will give a list of plugins that can be passed to the --check-type option of the psconfig maddash-grid command.
If you would further like to know what the default values used for thresholds and check frequency you can give the above command the --defaults option:
psconfig maddash-check-plugins --defaults
This will spit out the values for every single plugin as a JSON object. If you would like just the output of a single check you can run the following where TYPE is the name of the check plugin to view (e.g. ps-nagios-loss):
psconfig maddash-check-plugins --defaults --type TYPE
You will see some subset of the following values displayed in a JSON object for each check:
- critical-threshold - The threshold at which a critical alarm is raised. The units are check specific.
- warning-threshold - The threshold at which a warning alarm is raised. The units are check specific.
- check-interval - The amount of time as an ISO8601 to wait in between runs of a check. For example, if you want the dashboard to check a value every 4 hours, this would get set to
PT4H. - retry-attempts - When a state change is detected (e.g. a check that was previously OK crosses the critical threshold), the number of times to retry before changing that state in the dashboard.
- retry-interval - The amount of time as an ISO8601 to wait in between retry attempts. If not specified, check-interval is used.
- timeout - The amount of time as an ISO8601 to wait for a check to complete before labelling the result with an UNKNOWN state.
- params - This is a check-specific object that contains parameters specific to the check in question that can be manipulated. An example might include the amount of data to query each time a check is run or additional filters for the result.
- report-yaml-file - This property is only for advanced users. The path to a YAML file defining that can be inserted into the maddash.yaml
reportssection that defines pattens that generate the reports seen above grids and used to generate email notifications.
For information on manipulating these values see Adjusting Thresholds and Other Parameters.
Finally, if you would like even more detail about a particular plugin such as the types of tests supported, default paths to commands run, etc then you can run the following where TYPE is the name of the check plugin to view (e.g. ps-nagios-loss):
psconfig maddash-check-plugins --detail --type TYPE
Determining Visualization Plugins Installed
You can list all the visualization plugins installed on your host with the following command:
psconfig maddash-viz-plugins
It will give a list of plugins that can be passed to the --visualization-type option of the psconfig maddash-grid command. If you would like further detail about a particular plugin you can run the following where TYPE is the name of the visualization plugin to view (e.g. ps-graphs):
psconfig maddash-viz-plugins --type TYPE --detail
Adjusting Thresholds and Other Parameters
For many cases the default settings will be fine, but it is likely that at some point you may want to make adjustments. One of the most common changes to make is adjusting the thresholds used to alarm on values. You can adjust these by using the --check-critical-threshold and --check-warning-threshold of psconfig maddash-grid add or psconfig maddash-grid edit commands. The values accepted by these are check dependent.
For example, the default_throughput grid defined in the file that ships with the agent defines a check of type ps-nagios-throughput. This check type accepts thresholds in gigabits per second (Gbps). If we run the following we see defaults of .5 (.5 Gbps = ~500 Mbps) for the critical threshold and 1 (i.e. 1Gbps) for the warning:
psconfig maddash-check-plugins --defaults --type ps-nagios-throughput
Example Output:
ps-nagios-throughput:
{
   "critical-threshold" : ".5",
   ...
   "warning-threshold" : "1",
   ...
}
If we’d like to increase these thresholds in our grid named default_throughput to 6Gbps and 8Gbps respectively then we can run the following command:
psconfig maddash-grid edit --name default_throughput --check-critical-threshold 6 --check-warning-threshold 8
Alternatively, let’s say we want to update the default to now look at data over a wider time range. There is a check-specific parameter called time-range supported by ps-nagios-throughput that allows us to set the amount of data looked at by a check. This option is specified in seconds and defaults to 86400 (i.e. 1 day). We can change this to 1 week (604800 seconds) with the following command:
psconfig maddash-grid edit --name default_throughput --check-params '{"time-range": 604800}'
Note
time-range is not guaranteed to be supported by all checks since it is check specific and may not apply. Most of the checks beginning with the ps- prefix support it, but see Determining Check Plugins Installed for details on determining what values a check supports.
Note that we have to specify the check-specific value as a JSON string. There are numerous other options you can control, see psconfig-maddash-grid --help and the remaining sections for more details.
Adding Multiple Grids with the Same Check Type
It is often the case that you want to apply different thresholds and/or parameters to tasks of the same type. For example, consider the following tasks section of a template that describes three throughput tasks:
...
"tasks": {
    "task_low": {
        "group": "group_low",
        "test": "test_tput",
        "schedule": "schedule_tput"
    },
    "task_medium": {
        "group": "group_medium",
        "test": "test_tput",
        "schedule": "schedule_tput"
    },
    "task_high": {
        "group": "group_high",
        "test": "test_tput",
        "schedule": "schedule_tput"
    }
}
...
Now let’s assume as a starting point we have the default ps-nagios-throughput grid defined that ships with the agent. We can view just the ps-nagios-throughput grids with the following command:
psconfig maddash-grid list --check-type ps-nagios-throughput
Assuming we have the default, the output will look like the following:
{
   "default_throughput" : {
      "priority" : {
         "level" : 1,
         "group" : "throughput"
      },
      "check" : {
         "type" : "ps-nagios-throughput"
      },
      "visualization" : {
         "type" : "ps-graphs"
      },
      "display-name" : "Throughput"
   }
}
Let’s say that we want task_medium to use this grid, but we want to define different thresholds for task_low and task_high. We need to add two new grids that have the following properties:
- A task selector defined that tells the grid to only select tasks with certain features, in this case a name.
- Priorities defined that indicate that only one grid from a group of grids should be matched to each task so we don’t end-up with MaDDash drawing two grids of the same type for the same task.
Let’s look at the commands we’ll use to add these grids then break them down:
psconfig maddash-grid add --name low_throughput --check-type ps-nagios-throughput --visualization-type ps-graphs --display-name Throughput --priority-group throughput --priority-level 2 --check-critical-threshold .1 --check-warning-threshold .5 --selector-task-name task_low

psconfig maddash-grid add --name high_throughput --check-type ps-nagios-throughput --visualization-type ps-graphs --display-name Throughput --priority-group throughput --priority-level 2 --check-critical-threshold 6 --check-warning-threshold 8 --selector-task-name task_high
Looking first at the selection criteria, the above examples add the --selector-task-name to the psconfig maddash-grid add command with the name of the task from the template we want to match. There are other selector options based on the archive type or a custom JQ script, see psconfig maddash-grid --help for more details on those.
The priorities are slightly more complicated and are handled with the --priority-group and --priority-level options. To better understand, let’s look at what would happen with no priorities:
tasks_lowis a test of type throughput, so it would match thedefault_throughputarchive and MaDDash would create a grid for that. Since we also added a second grid calledlow_throughputwhich requires a test of type throughput and a task of nametask_lowwhich also matches, then a second grid would be drawn by MaDDash.- The fate of
tasks_highwould be similar totasks_low, except the second grid drawn would be the one defined byhigh_throughput tasks_mediumwould only matchdefault_throughput, so it would be displayed as desired
In the case of tasks_low and tasks_high we get an extra grid drawn by MaDDash if we don’t specify the priority. Priorities have two values: the group and the level. The group is a custom name, and only one MaDDash grid will be drawn for a task per priority group. We named our group throughput in this example. Within the priority group, the grid selected is the one matches the selection criteria AND has the highest priority of those that match. The default_throughput has a priority of 1 in our example. We set the priority level at 2 for our new grids. With this set, that means the grid with the --selector-task-name option set has the higher priority, so it will be favored if it matches. Note that in our example the --priority-level is the same for both low_throughput and high_throughput, which is fine since it is impossible for a task to match both. If this were a case where we were using a different selection criteria that made it possible for multiple grids with the same priority match, then the first grid encountered will be used. This is not very deterministic so it is generally advised you avoid situations where it is possible for two grids in the same priority group and with the same priority level match the same task.
The examples above show just changing the thresholds, but we can set any parameters in the new grid, just make sure the selectors and priorities are defined as desired.
Controlling the Display Properties
The agent gives control over how the names of rows, columns, grids and dashboards are displayed in MaDDash. The first name generated is that of the dashboard. This is the name that gets displayed in the Dashboards pulldown menu of MaDDash and at the top of the screen when you select that menu item. It is defined by a _meta property in the template itself called display-name. This name in question comes from a _meta object in the top-level of a template. For example:
{
    "_meta": {
        "display-name": "Example Dashboard"
    },

    "addresses": {...},

    "groups": {...},

    "tests": {...},

    "schedules": {...},

    "archives": {...},

    "tasks": {...}

}
If this property is not defined then an auto-generated value will be used that is much uglier.
Note
Remember that you can use transform scripts to have the agent modify the JSON including setting the display-name if one is not set in a remote template.
Similarly, the rows and columns use this same property, but defined in the addressses object of the template. If not specified the value of the address property will be used instead. The agent also supports the use of a display-url property that will be used to generate a hyperlink that can be visited by clicking on the hostname in a grid. For example:
"addresses": {
    "10.0.0.1": {
        "address": "10.0.0.1",
        "_meta": {
            "display-name": "Endpoint 1",
            "display-url": "https://10.0.0.1/toolkit"
        }
    },
    "10.0.0.2": {
        "address": "10.0.0.2",
        "_meta": {
            "display-name": "Endpoint 2"
        }
    }
}
Finally the name displayed directly above a MaDDash grid comes from three components all separated by a hyphen (-). The first part of the name is the dashboard name as described above. The second part of the name comes from the task objects display-name property if defined. If not defined, the key used to label the task in the tasks section of the template is used with some minor formatting. An example of the display-name property is shown below:
"tasks": {
    "task_low": {
        "group": "group_low",
        "test": "test_tput",
        "schedule": "schedule_tput",
        "_meta": {
            "display-name": "Slow Testers"
        }
    },
    "task_medium": {
        "group": "group_medium",
        "test": "test_tput",
        "schedule": "schedule_tput",
        "_meta": {
            "display-name": "Average Testers"
        }
    },
    "task_high": {
        "group": "group_high",
        "test": "test_tput",
        "schedule": "schedule_tput",
        "_meta": {
            "display-name": "Fast Testers"
        }
    }
}
The final part of the grid name comes not from the template, but from the agent. It will either use the value given to the --display-name option when running psconfig maddash-grid add or the --name option if the former was not specified. The command psconfig maddash-grid list should show the current value of display-name for each grid.
Troubleshooting
Looking at the last run with psconfig maddash-stats
One of the first steps to perform when debugging the pSConfig MaDDash agent is to get information about the last time the agent ran. A run in this context describes an instance when the agent downloaded all the templates it is configured to use, made any local modifications, matched task to configured grids and output the maddash.yaml file. As described in pSConfig MaDDash Agent’s Role, a run can be triggered by the passing of a set time interval (60 minutes by default) or a configuration file change.
Rather than manually digging through logs, pSConfig provides a tool for parsing summary information about the last run in the form of the psconfig maddash-stats command. The command does not require any options and is shown below:
psconfig maddash-stats
Below is an example of the successful output:
Agent Last Run Start Time: 2018/04/25 15:38:48
Agent Last Run End Time: 2018/04/25 15:38:49
Agent Last Run Process ID (PID): 3751
Agent Last Run Log GUID: BF30C416-489E-11E8-8BB6-530A118410B6
Total grids managed by agent: 8
From include files: 5
    /etc/perfsonar/psconfig/maddash.d/template.json: 5
From remote definitions: 3
    http://10.0.0.1/demo.json: 3
The output fields can be described as follows:
- Agent Last Run Start Time is the time when the agent began its last complete run.
- Agent Last Run End Time is the time when the last complete run ended.
- Agent Last Run Process ID (PID) is the process ID of the agent at the time of its last complete run. This should only change if the agent is restarted.
- Agent Last Run Log GUID is a globally unique ID used to identify a run in the logs. You can grep the log file with this ID to get the information about a specific run.
- Total grids managed by agent is the number of pSConfig task objects that match a grid configured by the agent from all input sources.
- From include files is the number of pSConfig task objects that match a grid configured by the agent that come from templates in the template include directory. Directly underneath that is a breakdown of the task count by the file from which they originate.
- From remote definitions is a count of the number of pSConfig task objects that match a grid configured by the agent that come from URLs added using the
psconfig remotecommand. Underneath is a breakdown of the task count by URL.
This command is useful as a quick health check of the agent. It can answer questions like:
- When did my agent last run?
- What templates is it using?
- Is it building the expected set of grids?
Also, if it throws an error that can be useful information too. In particular the output below is a good sign that your agent has never ran since it has not created the necessary log file:
Unable to open /var/log/maddash/psconfig-maddash-agent.log: No such file or directory
This script may not give all the answers, but will hopefully get things started when debugging unexpected behavior of the agent.
Reading the Logs
If you need to debug beyond what the utilities above provide from the logs, then you can manually look at the log files. There us one primary log used by the agent:
- The agent log lives at
/var/log/maddash/psconfig-maddash-agent.logand tracks basic information about agent activity and any errors encountered. A symlink can also be found at/var/log/perfsonar/psconfig-maddash-agent.logfor convenience.
The log is designed to by highly parsable with fields in the form of key=value separated by whitespace. Every line has a guid= field with an ID unique to the run of an agent. As an example, the GUID can be used for filtering log lines with grep or similar tools. It is often easiest to run the psconfig mddash-stats command to get the GUID of the last run as a launching point to parse the log. For example, looking at the example output from Looking at the last run with psconfig maddash-stats, the run had a GUID of BF30C416-489E-11E8-8BB6-530A118410B6. Knowing this GUID, all the log messages associated with that run can be queried using a command like the following:
grep "guid=BF30C416-489E-11E8-8BB6-530A118410B6" /var/log/maddash/psconfig-maddash-agent.log
You can further filter that output if needed, and hopefully eventually find the information needed to solve any issues encountered.
Advanced Configuration
The primary configuration file for the agent lives in /etc/perfsonar/psconfig/maddash-agent.json. Generally you should not have to edit that file directly, but if you are interested in the full set of options available, then see the schema file.
Note
This section will be expanded upon the completion of a command-line tool to aid in configuration.
Further Reading
- For a full listing of pSConfig MaDDash Agent related files see the reference here
- For information regarding dynamic templates and how they relate to the pSConfig MaDDash Agent see pSConfig Auto-Configuration