
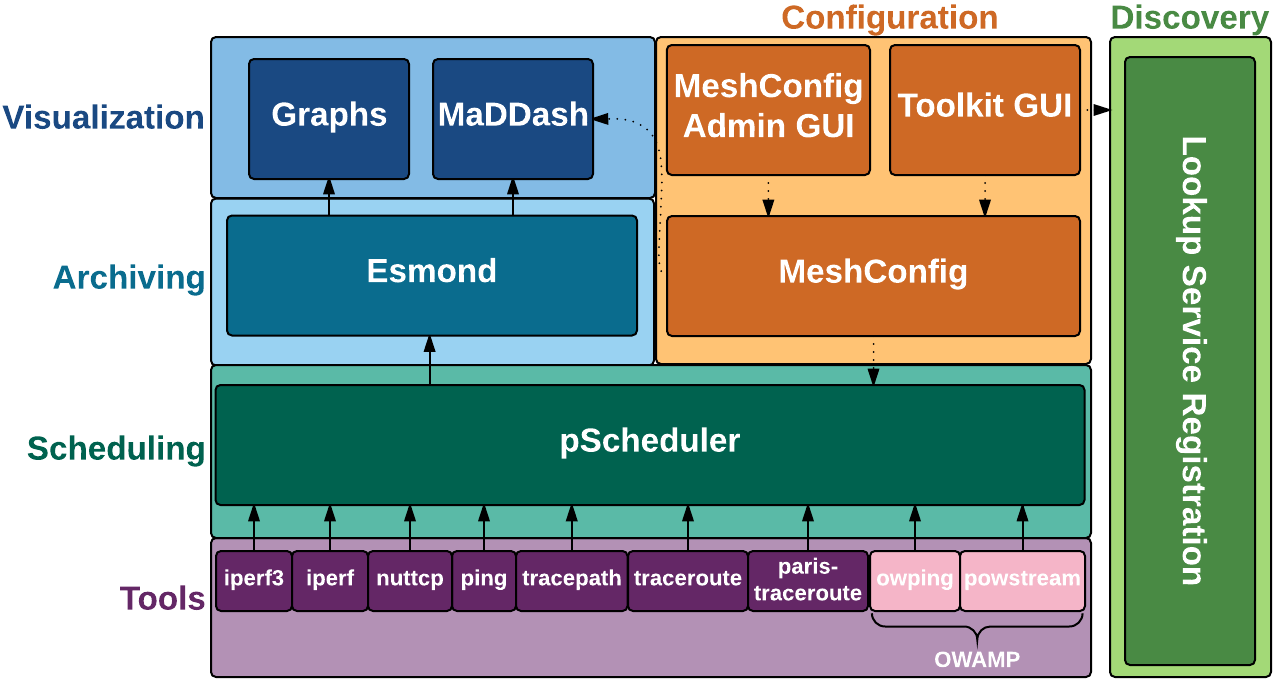
perfSONAR is a collection of open source software for performing and sharing end-to-end network measurements. It consists of multiple tools brought together in a manner best illustrated in the diagram below:
Your deployment may install some or all of the components depending on your goals. See perfSONAR Installation Options for a discussion on how to choose a deployment strategy that best suits your needs.
The sections that follow provide a brief in overview of the components at each layer and provide links to more detail where applicable.
perfSONAR includes numerous utilities responsible for carrying out the actual network measurements and form the foundational layer of perfSONAR. In general, you will not invoke these tools directly but instead use the pscheduler command from the scheduling layer to execute them. The default tools that come with perfSONAR include:
- owamp - A tool primarily used for measuring packet loss and one-way delay. It includes the command owping for single short-lived tests and the powstream command for long-running background tests.
- iperf3 - A rewrite of the classic iperf tool used to measure network throughput and associated metrics.
- iperf2 - Also known as just iperf, a common tool used to measure network throughput that has been around for many years.
- nuttcp - Another throughput tool with some useful options not found in other tools.
- traceroute - The classic packet trace tool used in identifying network paths
- tracepath - Another path trace tool that also measures path MTU
- paris-traceroute - A packet trace tool that attempts to identify paths in the presence of load balancers
- ping - The classic utility for determining reachability, round-trip time (RTT) and basic packet loss.
- bwctl - Deprecated in 4.0 The original perfSONAR scheduling tool but is now only used for backward compatibility with hosts running versions older than perfSONAR 4.0. It will be completely unsupported in a future release.
The scheduling layer consists of a single tool named pScheduler and is responsible for:
More information on using the pScheduler can be found in the section Running Measurements with pScheduler.
The archiving layer currently consists a single component named esmond that stores measurement information as time-series data. It is often referred to as the measurement archive (MA) and the term is used interchangeably with esmond. It can be installed on each measurement host if they meet hardware requirements or a single central instance may store results from multiple measurement hosts. For more information on esmond see the esmond documentation. For information on running a central measurement archive see Deploying a Central Measurement Archive.
In order to simplify the process above there are also a few graphical interfaces for defining tests:
- Toolkit GUI - This ships with every perfSONAR Toolkit and allows defining tests for the MeshConfig Agent on the local host only. See Configuring Regular Tests for more details.
- MeshConfig Administrative GUI - This is a GUI for defining remote meshes that can be read by the MeshConfig Agents of multiple hosts as well as the MeshConfig GUIAgent. See MeshConfig Administrative GUI for more details.
perfSONAR also includes components for visualizing the data. These components provide a window into the data and are the primary way most operators analyze and identify network issues. The primary tools provided by the main perfSONAR project are:
- Graphs - The perfSONAR graphs package provides a set of graphs that display the various measurements over time and provide useful information about the hosts involved. See Test Results Graphs for more detail.
- MaDDash - This component queries the archiving layer periodically for measurements and displays a dashboard indicating the performance of each relative to a set of defined thresholds. It can also send alerts based on patterns in the dashboard. See the MaDDash documentation for more details.
Each perfSONAR node can run a component called the Lookup Service (LS) Registration Daemon that registers its existence in a public and/or private lookup service. The registration daemon gathers information about each perfSONAR layer as well as the host on which it runs. This information is then used in multiple places to help debug problems and find hosts with which to test when building new configurations.
In general, no configuration is needed of the registration component but for a guide of the options available see Lookup Service Registration Daemon Configuration File. For a guide on automatically building test configurations based on registered lookup service content see Automatic Test Configuration with MeshConfig.
In addition to what’s included in the diagram above, there are some additional tools available that interact with one or more of the layers shown. For example:
- perfSONAR UI is a component that interacts with both the scheduling and archiving layers to execute tests and visualize results. It currently uses the legacy perfSONAR scheduling system and will be updated to support pScheduler in a future release. See perfsonarUI User Guide for more details.
Many of the layers provide open APIs, so its possible to use or write third-party tools to do even more. For information on the APIs available see perfSONAR Client API.